A team led by Kristen Guirguis, a climate researcher at Scripps Institution of Oceanography at UC San Diego, found evidence that the risk of hazardous weather is increasing in the Southwest.
The researchers investigated the daily relationships among four major modes of weather affecting California. How they interact governs the formation of weather events such as atmospheric rivers capable of bringing torrential rains and Santa Ana winds that can spread devastating wildfires.
“This study suggests that weather patterns are changing in a way that enhances hot, dry Santa Ana winds, while reducing precipitation frequency in the Southwest,” said Guirguis. “These changes in atmospheric circulation are raising the risk of wildfires during California winters.”
Dillard Road is flooded near the Hwy 99 off ramp, located south of Elk Grove, California. Photo credit: Florence Low / California Department of Water Resources.
The basis of the research was an examination of the dominant atmospheric circulation patterns over the North Pacific Ocean, known as Baja-Pacific, Alaskan-Pacific, Canadian-Pacific, and Offshore-California modes. What distinguishes them from each other are the relative positions of ridges and troughs in the atmosphere.
Weather patterns and a warmer atmosphere
The research team identified 16 recurring weather patterns that are created daily as these modes interact with each other. One product of the work was a summary of California weather patterns from 1949 to 2017. The patterns associated with the formation of dry gusty Santa Ana winds that often stoke Southern California fires are becoming more frequent. Patterns associated with what might be considered “normal” rainfall are decreasing in the Southwest thus promoting drought, but patterns associated with extreme precipitation and strong atmospheric river episodes have remained steady over the study period. The researchers noted that while the patterns associated with heavy precipitation and strong atmospheric rivers have not changed in frequency, a warmer atmosphere is capable of holding more water so these storms are becoming more damaging.
Challenges for wildfire and water resource management
The results suggest an increasing probability of compounding environmental hazards during California winters, said the research team. Though winter atmospheric rivers are the antithesis of hot, dry Santa Ana wind conditions, sequences of wildfires followed by strong atmospheric rivers often compound the damage from fires when they trigger flash floods and destructive debris flows from burn scars.
Photo of the Thomas Fire taken from a Santa Barbara beach. Photo credit: Carsten Schertzer / iStock.
“This spells challenges for wildfire and water resource management and provides observational support to our previous results projecting that California will increasingly have to depend on potentially hazardous atmospheric rivers and floodwater for water resource generation in a warming climate,” said study co-author Alexander Gershunov, a Scripps Oceanography climate scientist.
Study authors say this work is helping to inform an experimental subseasonal-to-seasonal (S2S) forecast product being developed at Scripps Oceanography’s Center for Western Weather and Water Extremes (CW3E) that predicts extreme weather in California including atmospheric river landfalls, Santa Ana winds, drought, and heat waves.
The U.S. Department of the Interior via the Bureau of Reclamation and the Southwest Climate Adaptation Science Center, the California Department of Water Resources, and the Regional Integrated Sciences and Assessments (RISA) California—Nevada Climate Applications Program and the International Research Applications Program of the National Oceanic and Atmospheric Administration funded the study. Additional funding was provided by the University of California Office of the President MRPI grant.
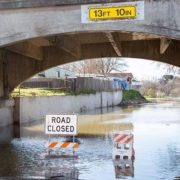
High water levels on the Tuolumne River close River Road in the city of Modesto, California, part of Stanislaus County. Photo credit: Dale Kolke / California Department of Water Resources.
The San Diego County Water Authority has a partnership with the Scripps Institution of Oceanography at UC San Diego to better predict atmospheric rivers and improve water management before, during and after seasonal storms.
(Editors Note: Study co-authors include Benjamin Hatchett of the Desert Research Institute in Nevada; Tamara Shulgina, Michael DeFlorio, Rosana Aguilera, achel Clemesha, Tom Corringham, Luca Delle Monache, and Marty Ralph of CW3E at Scripps Oceanography; Aneesh Subramanian and David Reynolds of the University of Colorado Boulder; Janin Guzman-Morales of the University of California Santa Barbara; and Alex Tardy and Ivory Small of the National Weather Service.)
https://www.waternewsnetwork.com/wp-content/uploads/2022/08/Flooding-primary-photo-UCSD-study.jpg450845Mike Leehttps://www.waternewsnetwork.com/wp-content/uploads/2024/04/WNN-Horizontal-White-Blue2.pngMike Lee2022-08-12 13:16:102022-08-12 13:16:10More Evidence that California Weather is Trending Toward Extremes
Following Governor Gavin Newsom’s recent executive order and a State Water Board emergency regulation, members of the California Urban Water Agencies, or CUWA, including the San Diego County Water Authority continue to advance water-saving efforts, yielding measurable results.
These efforts come on the back of the driest first quarter in California’s history, which prompted the Governor to call for local water conservation steps rather than a one-size-fits-all approach. As severe drought conditions persist, state and local agencies are working together to support the Governor’s call to action and lower water use across all sectors through a variety of measures.
“Water conservation a way of life”
“Governor Newsom has demonstrated strong leadership in directing water agencies to implement actions that are the best fit for the communities we serve,” said Water Authority General Manager and CUWA Board Chair Sandy Kerl. “We look forward to continued collaboration at the state and local level as we collectively prepare for a more resilient future.”
“While we have made historic investments to protect our communities, economy, and ecosystems from the worsening drought across the West, it is clear we need to do more,” said Governor Newsom in a press release. “Amid climate-driven extremes in weather, we must all continue to do our part and make water conservation a way of life.”
Water savings increase; long-term drought resilience the goal
The Carlsbad Desalination Plant uses reverse osmosis to produce approximately 10% of the region’s water supply; it is a core supply regardless of weather conditions, and it is blended with water from other sources for regional distribution. Photo: San Diego County Water Authority
Over the past few months, the Governor has convened a series of meetings with local water agencies, including Kerl and other CUWA representatives, to discuss progress and call for continued action. Since the first meeting in May, Californians have made substantial progress in conservation. Preliminary numbers suggest overall water use was down 7.5% in June compared to June 2020.
Based on an analysis of provisional data, CUWA agencies anticipate even greater water savings in July — about 10% on average compared to 2020, with several agencies exceeding 15% savings. This is due to significant investments in conservation rebates, turf replacement programs, public messaging, and outreach including stringent water use restrictions where necessary.
Beyond the immediate need for water conservation, Governor Newsom supports long-term drought resilience. “We are dealing with a changed climate in California that demands we reimagine not just how we use water, but how we capture, store and distribute it throughout the state,” Newsom said in a recent meeting.
In alignment with state priorities, CUWA members continue to invest in storage and drought-resilient supplies, such as water reuse and desalination, through local and collaborative regional efforts.
https://www.waternewsnetwork.com/wp-content/uploads/2022/08/Kerl-Newsom-Agency-Leaders-07.29.22-845X450.jpg450845Gayle Falkenthalhttps://www.waternewsnetwork.com/wp-content/uploads/2024/04/WNN-Horizontal-White-Blue2.pngGayle Falkenthal2022-08-10 07:43:162022-08-10 07:43:16Urban Water Suppliers Report Water Savings Progress Statewide
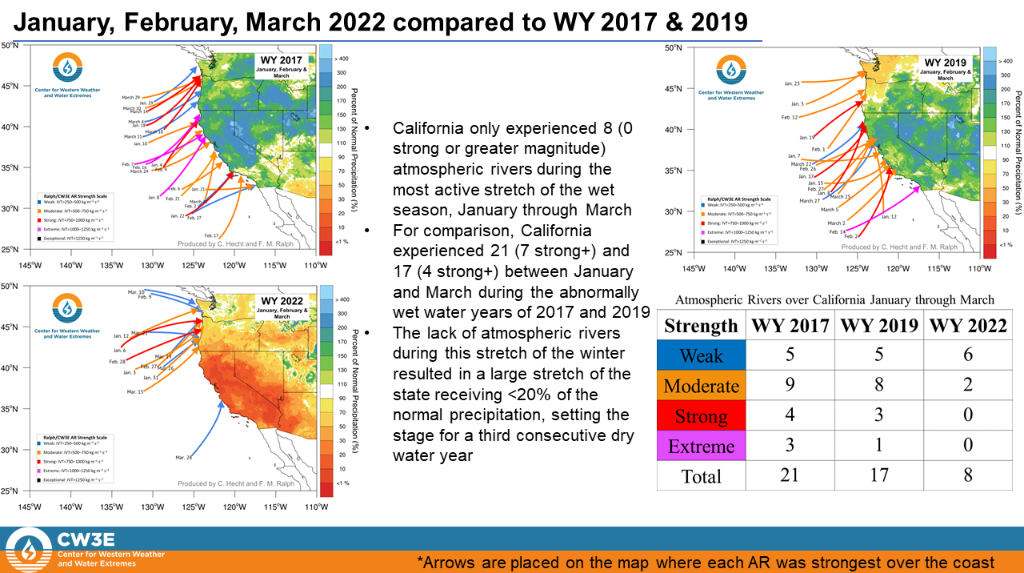
Few landfalling atmospheric rivers in the current water year have reached California, now in the third year of a statewide drought.
The latest update from the Center for Western Weather and Water Extremes, Scripps Institution of Oceanography at UC San Diego, shows that Water Year 2022 started strong in October, but weaker storms did not ease dry conditions.
Landfalling atmospheric rivers
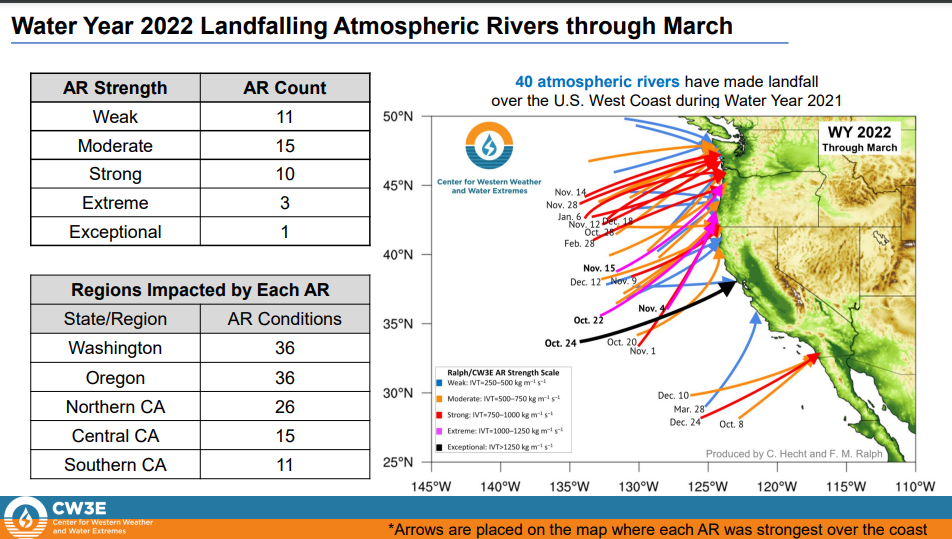
The CW3E report, Distribution of Landfalling Atmospheric Rivers over the U.S. West Coast During Water Year 2022: Summary Through March, was published April 7.
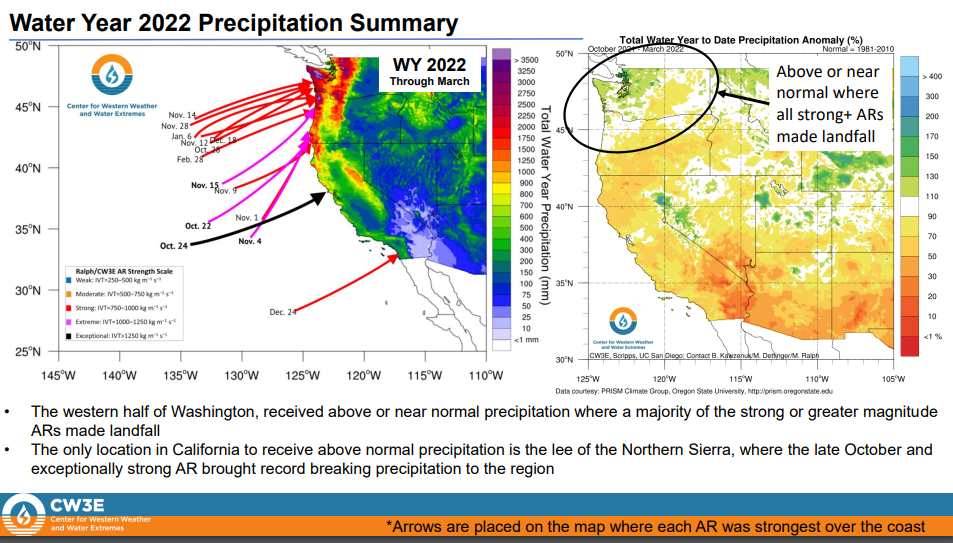
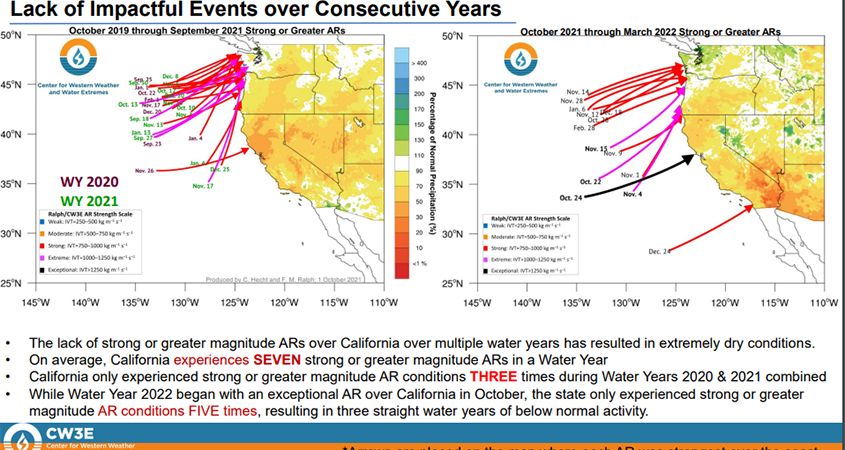
“While Water Year 2022 began with an exceptional AR over California in October, the state only experienced strong or greater magnitude AR conditions FIVE times, resulting in three straight water years of below normal activity,” according the report.
The report shows that the “lack of impactful events over consecutive years” – water year 2021 and water year 2020, combined with the current water year, has resulted in three straight years of below normal activity. Bottom line: If California hoped strong atmospheric rivers would end the current drought this water year, that’s not happening, at least so far. And the two previous years were a bust, creating extremely dry conditions across the state.
CW3E and Water Authority partnership
The San Diego County Water Authority partnered with the Scripps Institution of Oceanography, Center for Western Weather and Water Extremes, at UC San Diego in 2020 to better predict atmospheric rivers and improve water management before, during, and after those seasonal storms. The Center and its partners share best practices in forecast-informed reservoir operations, increased research around atmospheric rivers and droughts, and develop strategies for mitigating flood risk and increasing water supply reliability.
“Through our partnership with CW3E and the AR forecasting tools they’ve developed, it better prepares us in management of our water resources using regional storage,” said Jeff Stephenson, Water Resources Manager with the San Diego County Water Authority, in 2021. “This storage, in conjunction with developing multiple water supply sources in the San Diego region, has prepared us for years when rainfall levels are below normal in the region.”
California officials have urged residents to prepare for a third year of drought and urged people to conserve water.
“With only one month left in California’s wet season and no major storms in the forecast, Californians should plan for a third year of drought conditions,” said California Department of Water Resources Director Karla Nemeth. “A significantly below-average snowpack combined with already low reservoir levels make it critical that all Californians step up and conserve water every day to help the state meet the challenges of severe drought.”
A dry February has our Sierra snowpack below average for this date. With only one month left of the rainy season, Californians should prepare for #drought conditions to continue if snowpack levels are not rebuilt with heavy storms by the end of the winter season. –#cawaterpic.twitter.com/VUIOQ7lAaH
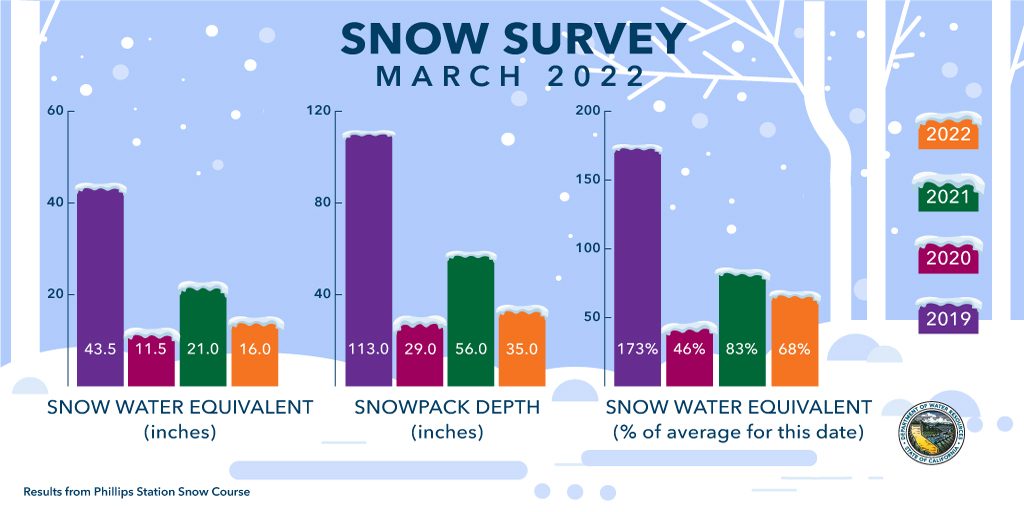
The DWR conducted the third snow survey of the season March 1 at Phillips Station.
Following a January and February that will enter records as the driest documented in state history, the manual survey recorded 35 inches of snow depth and a snow water equivalent of 16 inches, which is 68% of average for this location for March, according to the DWR. The snow water equivalent measures the amount of water contained in the snowpack and is a key component of DWR’s water supply forecast. Statewide, the snowpack is 63% of average for this date.
The La Niña pattern continues next week, according to @NOAA’s @NWSCPC.
Northern areas look relatively wet, while CA, the Southwest, and Southern Plains look dry. At least parts of the South/Southeast may buck that trend.
Water conservation “a way of life” in San Diego County
“As we enter a third year of drought, we encourage residents and businesses in San Diego County to increase their water conservation efforts,” said Jeff Stephenson, water resources manager with the San Diego County Water Authority. “While the Water Authority and its 24 member agencies have worked to create multiple sources of water supply for the region, there are still opportunities, including rebates, to save more water.”
In San Diego County, the website, watersmartsd.org, provides sources of residential and business rebates, including indoor and outdoor incentives, agricultural programs, and free landscape makeover classes.
Stephenson added that the region has reduced its reliance on imported water supplies, including from the Sacramento-San Joaquin Bay Delta, which means more of that source is available for other parts of California.
“As the world continues to warm, precipitation is pushing toward extremes. Even when we see large storms producing a lot of snow early in the season, all it takes is a few dry weeks to put us below average." -Jeremy Hill, Manager of DWR’s Hydrology and Flood Operations Branch. pic.twitter.com/3nIzMHhvqn
Governor Gavin Newsom has asked all Californians to cut back water use at least 15% compared to 2020 levels. Regionally, the Northern, Central, and Southern Sierra snowpacks are all standing just above 59% to 66% of average for this date, impacting watersheds across the state, according to the DWR.
“As the world continues to warm, precipitation is pushing toward extremes,” said Jeremy Hill, Manager of DWR’s Hydrology and Flood Operations Branch. “Even when we see large storms producing a lot of snow early in the season, all it takes is a few dry weeks to put us below average. This new pattern challenges forecasting efforts that have relied on historical patterns, so DWR has led the charge to adopt new technologies and utilize the best available science to manage water in real time and use forecasts that give us time to make decisions to get the most benefits and minimize the hazards.”
California Drought
An extremely dry January and February have wiped out an early season surplus and brought the February snowpack below average. With no storm relief in sight, Californians should prepare for drought conditions to continue, the DWR tweeted March 1. Graphic: California Department of Water Resources
Dry times in the Golden State
Although early season storms helped alleviate some drought impacts, a lack of storms in January and February heightens the need for conservation. The Governor has asked all Californians to cut back water use at least 15 percent compared to 2020 levels. Regionally, the Northern, Central, and Southern Sierra snowpacks are all standing just above 59 percent to 66 percent of average for this date, impacting watersheds across the state.
“With below average precipitation and snowpack up until this point, our latest statewide snowmelt forecasts are only 66 percent of average,” said Sean de Guzman, Manager of DWR’s Snow Surveys and Water Supply Forecasting Unit. “That is not enough to fill up our reservoirs. Without any significant storms on the horizon, it’s safe to say we’ll end this year dry and extend this drought a third year.”
"That is not enough to fill up our reservoirs. Without any significant storms on the horizon, it’s safe to say we’ll end this year dry and extend this drought a third year.” – Sean de Guzman, Manager of DWR’s Snow Surveys and Water Supply Forecasting Unit. –#saveourwaterpic.twitter.com/2h9tdfMcTw
https://www.waternewsnetwork.com/wp-content/uploads/2022/03/Snowpack-Survey-DWR-Drought-primary.jpg450845Mike Leehttps://www.waternewsnetwork.com/wp-content/uploads/2024/04/WNN-Horizontal-White-Blue2.pngMike Lee2022-03-02 09:21:592022-03-03 07:15:02California Drought Now in Third Year
Research on atmospheric rivers takes flight as UC San Diego’s Center for Western Weather and Water Extremes taps “Hurricane Hunter” aircraft for specialized scientific missions.
The aircraft will fly for a 13-week period (that began January 5) to glean critical data for improving forecasts of atmospheric river storms over the Pacific Ocean. Those storms, or “AR’s,” provide up to half of the U.S. West Coast’s annual precipitation and a majority of the flooding.
The flights are part of the Atmospheric River Reconnaissance program led by UC San Diego’s Center for Western Weather and Water Extremes (at Scripps Institution of Oceanography) with support from the U.S. Army Corps of Engineers and California Department of Water Resources. The AR Recon program works in coordination with NOAA’s Office of Marine and Aviation Operations and the U.S. Air Force Reserve 53rd Weather Reconnaissance Squadron “Hurricane Hunters” to carry out data-collecting missions within these storms.
Two Air Force Reserve WC-130J Super Hercules aircraft are on standby to fly out of Mather Air Force Base near Sacramento, when atmospheric rivers approach the West Coast. NOAA will station its Gulfstream IV-SP jet in Hawaii during this year’s operations.
Dropsonde instruments will be deployed from these aircraft over specialized transects over atmospheric rivers, transmitting critical data on the vertical profile of water vapor, wind, and temperature carried in fast-moving, low-altitude airstreams that form the atmospheric river.
For 13 weeks, two Air Force WC-130J Super Hercules aircraft & the NOAA Gulfstream IV-SP jet will be on standby to fly over atmospheric rivers. ✈️ They’ll deploy instruments collecting data on water vapor, wind, & temp in the low-altitude airstreams over the Pacific that form ARs. pic.twitter.com/kAOKBYKSeh
— Scripps Institution of Oceanography (@Scripps_Ocean) January 12, 2022
The San Diego County Water Authority is a partner with the Scripps Institution of Oceanography, Center for Western Weather and Water Extremes, at UC San Diego, as part of the effort to better predict atmospheric rivers and improve water management before, during, and after those seasonal storms. The partnership started in 2020.
AR Forecasting and Water Supply
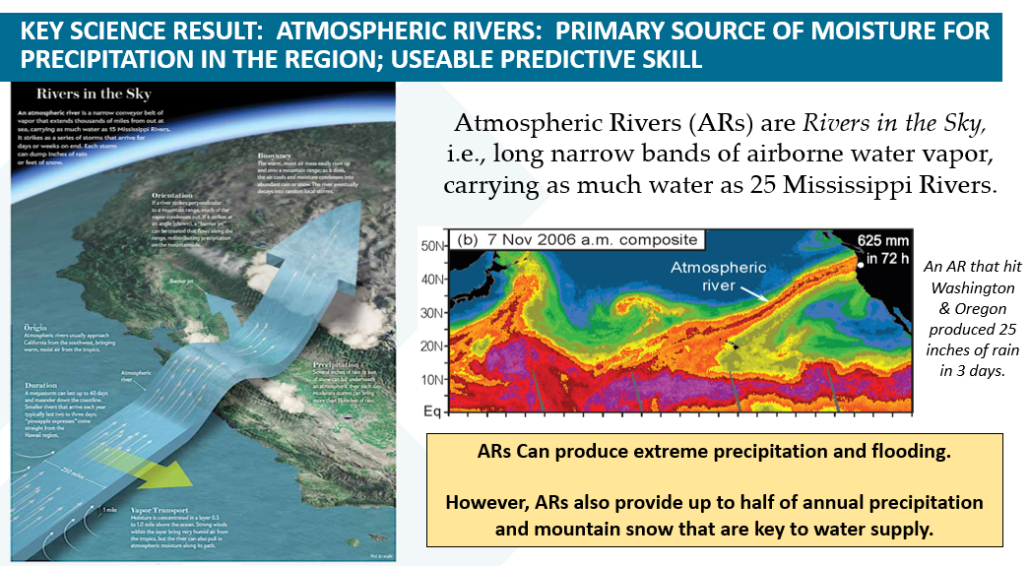
An average atmospheric river carries 25 times the water equivalent of the Mississippi River in the form of vapor instead of liquid. These storms can cover a swath about 500 miles wide while extending thousands of miles in length. They pack winds ranging from more than 50 miles an hour to hurricane force.
“Science has discovered that the leading source of error in predicting when and where an atmospheric river will strike the U.S. West Coast, and how much precipitation it will create, is the position and structure of the atmospheric river itself offshore, prior to landfall,” said Scripps research meteorologist and CW3E Director F. Martin Ralph. “Obtaining accurate environmental measurements in and near the atmospheric river offshore using these aircraft and drifting ocean buoys has a significant impact on forecast accuracy. AR Recon not only fills in many data gaps over the Pacific Ocean for prediction, it supports improved scientific understanding that over time improves forecasts as well. These improvements are vital for water managers and public safety.”
Ralph leads AR Recon 2022, working closely with Vijay Tallapragada, who heads modeling efforts for the National Weather Service’s Global Forecast System (GFS); and Jim Doyle, who leads the Naval Research Laboratory’s Coupled Ocean/Atmosphere Mesoscale Prediction System.
California drought cycles and ARs
Atmospheric rivers have helped break more than 40% of California’s droughts throughout recorded history. They also generate many of California’s most extreme precipitation events, driving 90% of California’s heaviest rains in bursts lasting one to three days. They are also responsible for as much as $1 billion a year in flood damages in western states.
California’s climate variability
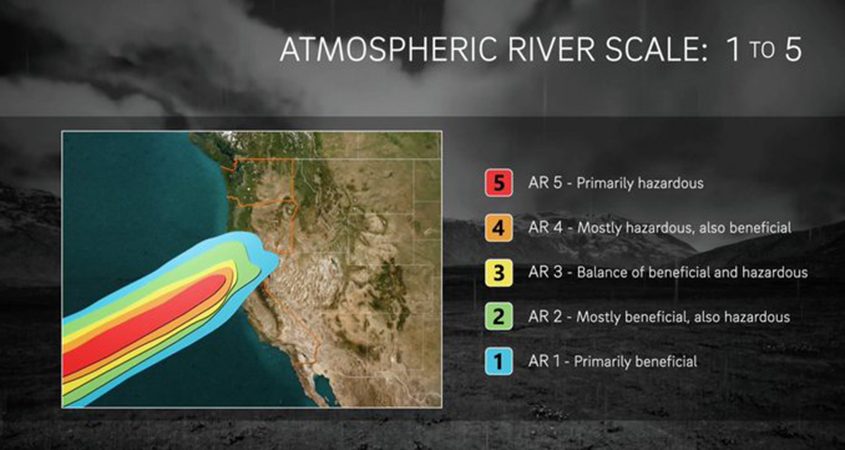
Although meteorologists can see atmospheric rivers forming as much as eight days in advance, landfall forecasts can be hundreds of miles off target. AR Recon data improves forecasts of their intensity, allowing forecasters to more precisely determine the potential benefits or hazards of atmospheric rivers. Situationally, they can refill reservoirs or bring flooding and debris flows. Real-time data will also be incorporated into AR scale rankings, which can serve as a predictive indicator of the storm’s damage or benefit.
“AR Recon has been a key monitoring element of the State’s Atmospheric River Research Program and is a great example of collaborative engagements that lead to improvements in precipitation prediction, providing multiple benefits to water managers seeking to understand climate change-caused weather extremes,” said Michael Anderson, state climatologist with the California Department of Water Resources.
As California alternates between extremes of drought and flood, accurate forecasts are increasingly vital to water managers. A collaborative program called Forecast-Informed Reservoir Operations (FIRO) uses modern forecasting methods to give reservoir operators better decision-making tools to optimize water resources. FIRO is developing the capability for these advanced forecasts to help water managers decide whether to retain water if no additional storms are forecast or release it to mitigate the risk of flooding.
Atmospheric river research helps forecasting, water management
“Research on atmospheric rivers from the Atmospheric River Reconnaissance program has helped us better predict, mitigate, and optimize these weather events in California,” said U.S. Sen. Dianne Feinstein (D-CA). “Applying this data through Forecast-Informed Reservoir Operations means better flood protection and improved water storage to help lessen the effects of drought.”
“Water managers within the U.S. Army Corps of Engineers have long maintained that they can do a better job of making water management decisions if weather forecasts were better – i.e. more accurate at longer lead times,” said Cary Talbot, chief of the Flood and Storm Protection Division at the U.S. Army Engineer Research and Development Center. “The AR Recon program, combined with the increased flexibility afforded by the FIRO program, is making better water management a reality in California and across the West because the forecasts are improving in both accuracy and lead time.”
AR Recon observations began in 2016. This year the mission window will expand to 13 weeks, three weeks longer than last year.
In addition to using dropsondes, the Air Force Reserves and ships of opportunity deployed 50 additional drifting buoys in key locations throughout the northeast Pacific this season, joining 48 buoys active from previous seasons. These buoys provide vital sea-level pressure, water temperature, and wave measurements from a region lacking data needed for numerical weather predictions and climate studies. The buoy deployments were completed in partnership with the Scripps-based, NOAA-funded Global Drifter Program (GDP), the California Department of Water Resources, and the U.S. Army Corps of Engineers.
Data gathering using GPS signals
Air Force Reserve aircraft will also be equipped with what are known as airborne radio occultation capabilities. Proven on NOAA’s Gulfstream IV-SP platform in previous seasons, the airborne radio occultation technique uses GPS signals to detect variations in atmospheric properties and provide critical moisture and temperature profiles in the larger environment surrounding the aircraft, complementing the dropsondes.
Neither satellites nor other conventional observation methods can detect conditions captured from buoys and dropsondes. In offshore areas from the ground to a height of several miles, AR Recon dropsonde data account for most temperature and humidity observations and almost half of the wind observations. These data plug a serious gap in the standard network of weather observations impacting the U.S. mainland.
Weather officers and navigators of the U.S. Air Force Reserves will embed at Scripps Oceanography for flight planning this season, assisted by a team from NOAA’s Environmental Modeling Center and flight directors from NOAA’s Aircraft Operations Center. About 50 people aid flight planning throughout the season, including approximately 20 from Scripps Oceanography and up to 15 from the Air Force Reserves.
The AR Recon Program has grown from a demonstration phase in 2016 to an operational requirement in 2019 and is now included in the federal National Winter Season Operational Plan. It has expanded from flying three storm Intense Observation Periods in 2016 to 30 such periods in 2021, with more than 117 aircraft missions flown and data from more than 3,000 dropsondes assimilated in real-time operations.
AR Recon data used for global weather models
Leading global weather models at NOAA and the National Weather Service, the U.S. Navy, and European agencies and others incorporate AR Recon data into their forecasts. In the northeast Pacific, AR Recon observations have improved precipitation forecasts over the western United States. They also provide a more accurate analysis of upstream atmospheric conditions before potential high-impact weather events develop over the central and eastern parts of the country.
“Real-time assimilation of AR Recon observations have made a significant impact on NOAA’s operational GFS, particularly for the precipitation forecasts along the west coast of the United States, with forecast improvements exceeding 20-30 percent in areas where heavy precipitation occurs due to landfalling atmospheric rivers,” said Vijay Tallapragada, Chief of Modeling and Data Assimilation Branch at NOAA’s Environmental Modeling Center.
The Research and Operations partnership established through the AR Recon Program has enabled scientists from NOAA working closely with CW3E and the Navy in developing advanced sampling strategies for mission planning and targeted collection of observations critical for improving the analysis and forecasts. The AR Recon observations also have notably improved key aspects of NOAA’s GFS. Wind forecasts alone have improved by 17% after including AR Recon data. The Navy has found that AR Recon data improves forecasts as much as all the data collected from balloon-borne radiosondes in North America.
The recent report from NOAA’s Science Advisory Board on Priorities for Weather Research explicitly recommended the implementation of a multi-phase program to improve atmospheric river forecasting to better anticipate and mitigate extreme precipitation swings and their cascading impacts.
In 2022, the AR Recon Program will include, for the first time, real-time data collection and feedback that can instantly impact experiments being carried out with NOAA’s GFS. Making this possible are the computational resources provided by San Diego Supercomputer Center’s “COMET” to facilitate documenting the forecast improvements and support mission planning.
(Editor’s Note: Follow the work of Scripps Institution of Oceanography scientists at the Center for Western Weather and Water Extremes on Twitter at @CW3E_Scripps, the U.S. Air Force Reserves Weather Reconnaissance Squadron at @53rdWRS, and NOAA Aircraft Operations Center at @NOAA_HurrHunter.)
https://www.waternewsnetwork.com/wp-content/uploads/2022/01/AR-Research-SIO-Primary-Yuba-Water-Agency-SIO.jpg450845Mike Leehttps://www.waternewsnetwork.com/wp-content/uploads/2024/04/WNN-Horizontal-White-Blue2.pngMike Lee2022-01-13 16:52:352022-07-07 13:07:54Atmospheric River Storm Observations Take Flight Over Pacific Ocean
The California Department of Water Resources conducted the first Phillips Station snow survey of the season on Thursday, Dec 30 after the basin received over 200 inches of snow, and will potentially see more in the coming week.
https://www.waternewsnetwork.com/wp-content/uploads/2024/04/WNN-Horizontal-White-Blue2.png00Gayle Falkenthalhttps://www.waternewsnetwork.com/wp-content/uploads/2024/04/WNN-Horizontal-White-Blue2.pngGayle Falkenthal2022-01-04 10:04:272022-01-04 10:08:29Snow Pack Measurement Reveals We’re Far From Drought Recovery, According to CDWR
The Center for Western Weather and Water Extremes, or CW3E, at Scripps Institution of Oceanography, released its report October 11 on atmospheric rivers during Water Year 2021.
The report, “Distribution of Landfalling Atmospheric Rivers over the U.S. West Coast During Water Year 2021: End of Water Year Summary” shows that more atmospheric rivers landed on the U.S. West Coast in Water Year 2021 than in Water Year 2020. But the majority of those storms reached the Pacific Northwest, not California, where drought conditions have impacted water supply.
“The report on atmospheric rivers shows the variability in weather across the state from year to year,” said Jeff Stephenson, Water Resources Manager with the San Diego County Water Authority. “Through our partnership with CW3E and the AR forecasting tools they’ve developed, it better prepares us in management of our water resources using regional storage. This storage, in conjunction with developing multiple water supply sources in the San Diego region, has prepared us for years when rainfall levels are below normal in the region.”
The summary report from CW3E
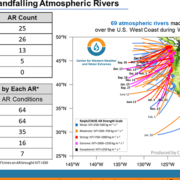
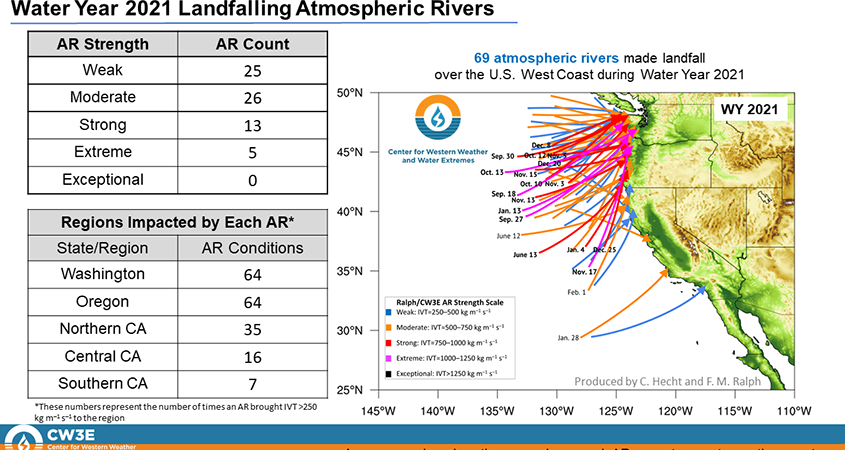
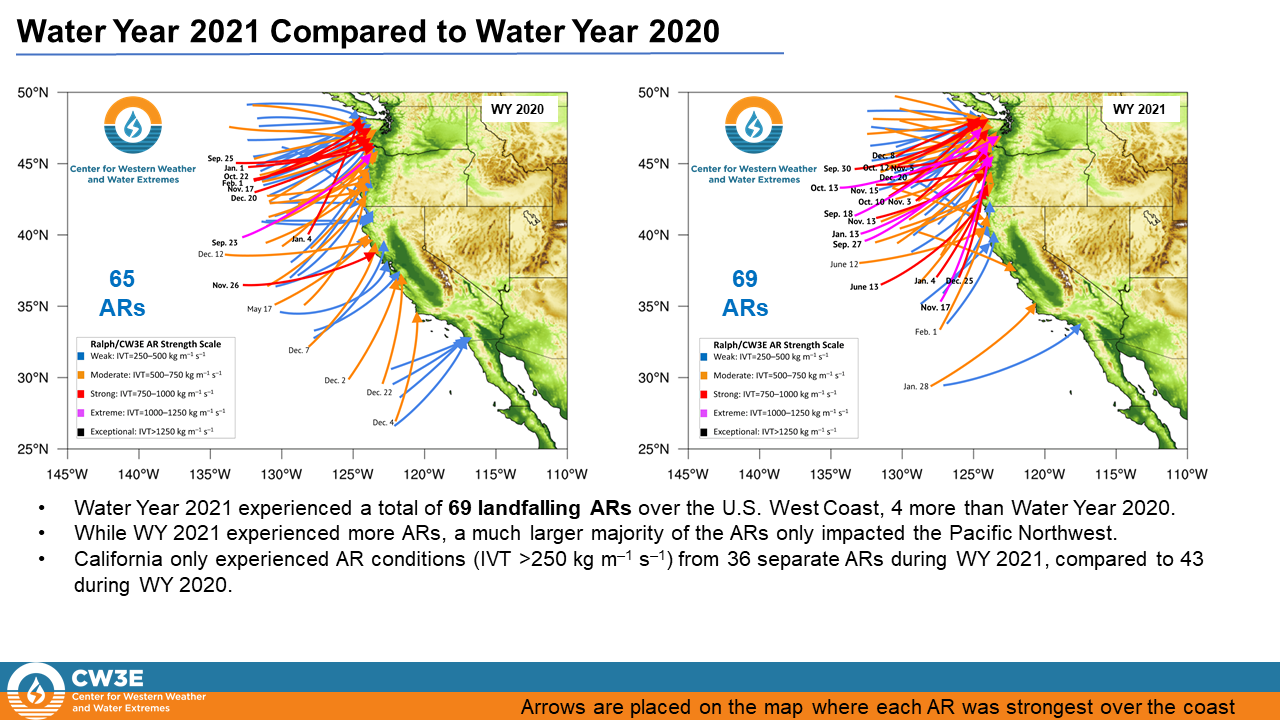
Water Year 2021 experienced a total of 69 landfalling ARs over the U.S. West Coast, 4 more than Water Year 2020.
• While WY 2021 experienced more ARs, a much larger majority of the ARs only impacted the Pacific Northwest.
• California only experienced AR conditions (IVT >250 kg m–1 s–1) from 36 separate ARs during WY 2021, compared to 43
during WY 2020.
Distribution of Landfalling Atmospheric Rivers over the U.S. West Coast During Water Year 2021: End of Water Year Summary. Graphic: Center for Western Weather and Water Extremes
Fewer Atmospheric Rivers in California
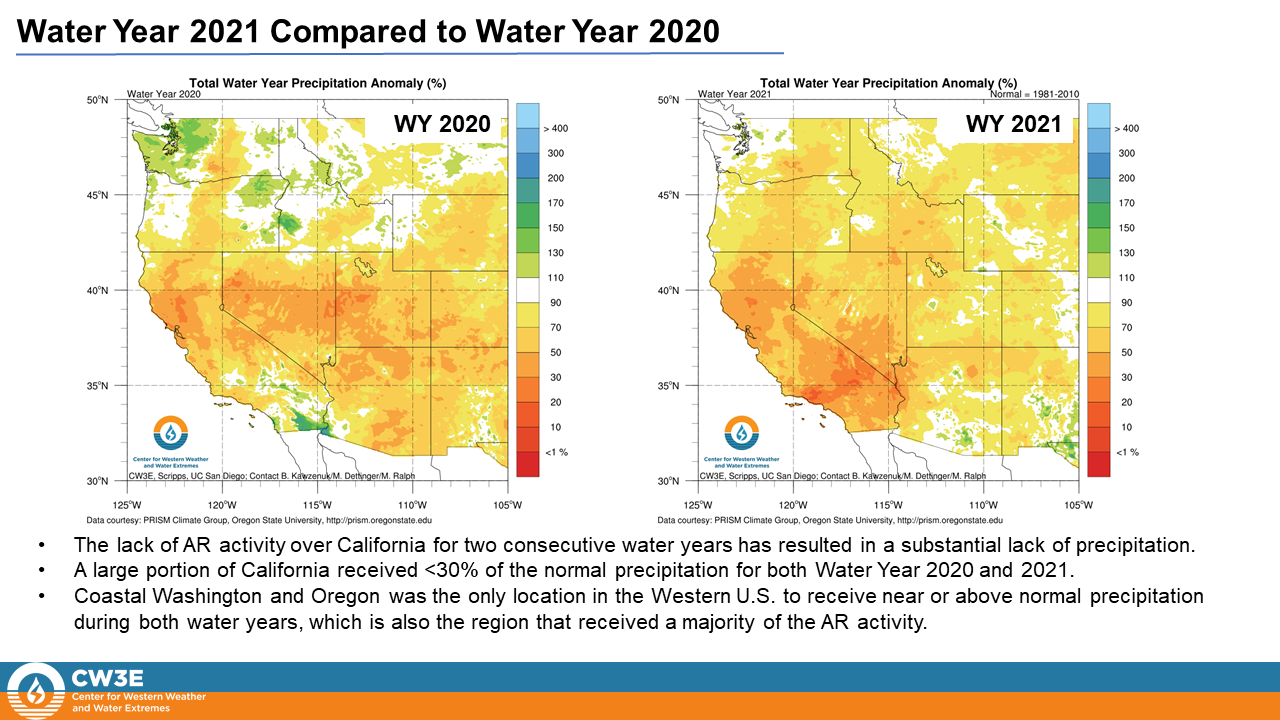
The lack of AR activity over California for two consecutive water years has resulted in a substantial lack of precipitation.
• A large portion of California received <30% of the normal precipitation for both Water Year 2020 and 2021.
• Coastal Washington and Oregon was the only location in the Western U.S. to receive near or above normal precipitation
during both water years, which is also the region that received a majority of the AR activity.
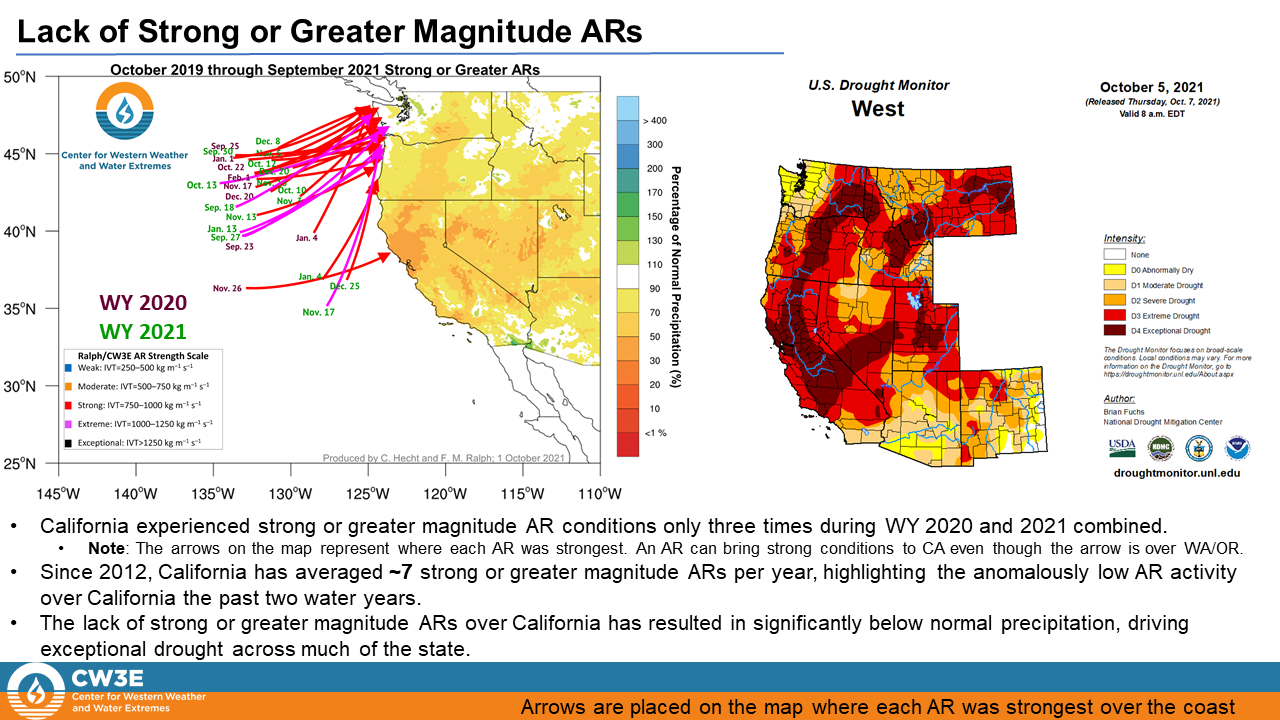
California experienced strong or greater magnitude AR conditions only three times during WY 2020 and 2021 combined
The San Diego County Water Authority partnered with the Scripps Institution of Oceanography, Center for Western Weather and Water Extremes, at UC San Diego in 2020 to better predict atmospheric rivers and improve water management before, during, and after those seasonal storms. The Center and its partners share best practices in forecast-informed reservoir operations, increased research around atmospheric rivers and droughts, and develop strategies for mitigating flood risk and increasing water supply reliability.
https://www.waternewsnetwork.com/wp-content/uploads/2021/10/Atmospheric-Rivers-CW3E-Primary.png450845Mike Leehttps://www.waternewsnetwork.com/wp-content/uploads/2024/04/WNN-Horizontal-White-Blue2.pngMike Lee2021-10-12 13:36:392021-10-12 15:49:06Atmospheric Rivers Left California Mostly Dry in Water Year 2021
Agriculture values topped $1.8 billion for the first time since 2014 and just the third time in 30 years in the County of San Diego’s annual Crop Report that covers the 2020 growing season, overcoming decreases in many crop values and reported mixed effects of the coronavirus pandemic.
The total value of all agriculture crops and commodities rose just 0.8% in the new Crop Report. But that was enough to push total values from $1,795,528,573 in 2019 to $1,810,326,411.
It was the fourth time in the past five Crop Reports that overall agriculture values increased, and the third time since 1990 that total values topped $1.8 billion in San Diego County. Values exceeded $1.8 billion in both 2013 and 2014.
Top crops
The overall increase in 2020 was boosted by gains from the two largest groups of crops grown in the county — Nursery & Cut Flower Products, which account for 70% of all crop values; and Fruit & Nut Crops, which account for 19% of all crop values.
Nursery & Cut Flower Products increased 2%, from $1.25 billion to $1.27 billion. Fruit & Nut Crops increased 0.7%, from roughly $342 million to $344 million.
A smaller agriculture group, Forest Products, which includes timber and firewood, increased 1.5% from $855,154 in 2019 to $868,398.
But the other four crop groups decreased — Vegetable & Vine Crops, Field Crops, Apiary Products and Livestock and Poultry.
The largest of those groups, Vegetable & Vine crops, which account for 7% of total agriculture values, decreased 6.3%, from roughly $131 million to $122 million. It marked the fourth decline for Vegetable & Vine crops in the past five reports.
The report stated that the effects of the coronavirus pandemic appeared to be mixed. Some growers reported labor shortages and business closures; others suggested the people staying home because of the pandemic may have increased demand for items such as bedding plants, perennials, and indoor flowering and foliage plants.
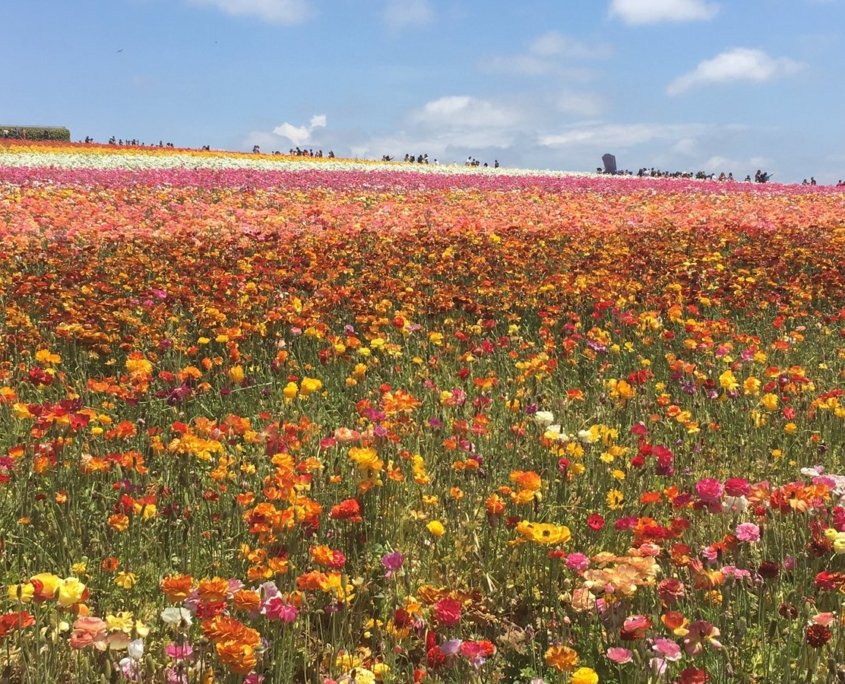
The overall increase in San Diego County 2020 agriculture values was boosted by gains from the one of the two largest groups of crops grown in the county: Nursery & Cut Flower Products, which account for 70% of all crop values. Photo: Carlsbad Flower Fields / Ed Joyce
Ornamental Trees & Shrubs
Among the individual crops, the county’s king of the annual Top 10 list continued to be Ornamental Trees & Shrubs despite a 3% decrease in total value.
Ornamental Trees & Shrubs decreased from $445 million in 2019 to $432 million, but still edged out the number two crop, Bedding Plants, Color & Herbaceous Perennials, Cacti & Succulents, at $431.8 million.
Avocados in 4th Place on Top 10 list
San Diego County’s most well-known crop, Avocados, remained in fourth place on the Top 10 list, increasing in value in 2020 by 9.2%, from nearly $140 million to nearly $153 million, after increasing nearly 16% in 2019.
The rest of the Top 10 crops remained relatively similar to past years. Oranges and Livestock and Poultry exchanged places, with Oranges falling from the seventh spot to eight, and Livestock and Poultry rising from eight to seven.
The annual Crop Report is compiled by the County’s Department of Agriculture, Weights and Measures and can be seen online. The report provides a yearly snapshot of an industry that remains a staple of the region’s economy despite challenges like drought, rising water costs, fires, freezes, pests and the pandemic.
County Board of Supervisors actions support agriculture
San Diego County’s Board of Supervisors has taken several actions over the years to boost agriculture, including creating a boutique winery ordinance to promote the creation of small wineries; approving a beekeeping ordinance that allows more beekeeping while protecting the public; adopting an agricultural easement program that preserves agricultural space; and streamlining regulations for things like cheese-making, agritourism and onsite horticultural sales.
Last year, the Board unanimously voted to help growers by deferring fees for export certification, direct marketing, and hazardous materials inventory, allowing growers use those funds for operation needs during the pandemic.
“Farming thriving”
Supervisor Jim Desmond represents the County’s Fifth supervisorial district, which is home to a lot of the county’s agricultural land.
“During the pandemic, we have seen how essential farming is in San Diego County,” Desmond said. “Despite a difficult past 16 months for everyone, it’s great to see farming thriving. It is an honor to be the supervisor of District Five, which has a diverse variety of agricultural crops ranging from flowers to strawberries and avocados!”
Other highlights from the report include:
Wine grapes decreased in total value by nearly 7%, from roughly 5.6% million to $5.2 million, after posting 21.5%, 19% and 28% gains the previous three years.
At $431 million, Bedding Plants, Color & Herbaceous Perennials, Cacti & Succulents accounted for 24% of the region’s total agriculture production.
The 9.2% increase in avocado’s value was fueled in part by a 46% increase in yield.
Although total citrus values decreased by 3%, grapefruit crop values increased by 14%.
Here’s a look at the 2020 Top 10 crops:
(Editors note: This story by Gig Conaughton, County of San Diego Communications Office)
https://www.waternewsnetwork.com/wp-content/uploads/2021/08/Photo-contest-WNN-Charlie-4.18.2019-845x450-1.jpg450845Mike Leehttps://www.waternewsnetwork.com/wp-content/uploads/2024/04/WNN-Horizontal-White-Blue2.pngMike Lee2021-08-12 16:09:572022-07-07 13:14:25Agriculture Tops $1.8 Billion in New SD County Crop Report
Climate change and drought will impact San Diego County’s climate future, but regional water supply planning and adaptation measures will ensure a safe, reliable supply for the region.
Panel moderator Kelley Gage, Water Authority Director of Water Resources, kicked off the climate conversation by describing the investments and steps taken by the Water Authority and its 24 member agencies to secure the region’s water future.
Water supply and San Diego County’s climate future
“Since our founding more than 75 years ago, our mission in partnership with our 24 member agencies is to ensure a clean and reliable supply of water for the region,” said Gage. “As part of that mission we’re involved in partnerships like the one that we have today and the research to ensure that we have planned for the impact of climate change in our water supplies.”
Gage said the Water Authority has developed a climate action plan.
“As part of our strategic planning we have developed a climate action plan which is an interdisciplinary effort to promote and coordinate implementation of climate change strategies and related activities across the Water Authority,” said Gage. “We have reached our goals for 2020 and we are on track for our 2030 goals.”
Atmospheric rivers and water management
The Water Authority partnered with the Scripps Institution of Oceanography, Center for Wester Weather and Water Extremes, at UC San Diego in 2020 to better predict atmospheric rivers and improve water management before, during, and after those seasonal storms. The Center and its partners share best practices in forecast-informed reservoir operations, increased research around atmospheric rivers and droughts, and develop strategies for mitigating flood risk and increasing water supply reliability.
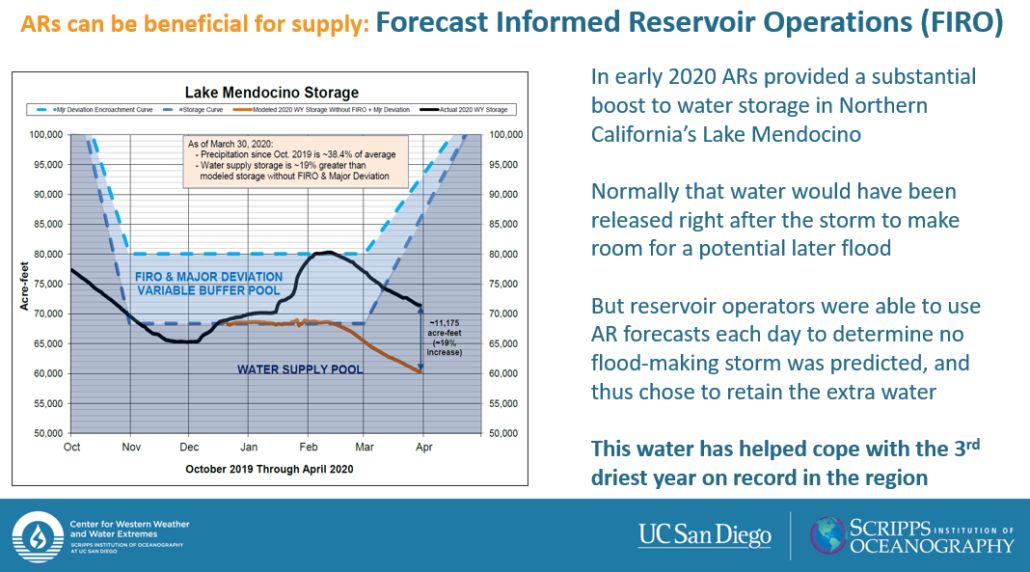
Stored water releases
Marty Ralph, Researcher in Climate, Atmospheric Science & Physical Oceanography at Scripps Institution of Oceanography, and Director of the Center for Western Weather and Water Extremes, opened the panel with information on advanced research around atmospheric rivers.
Atmospheric rivers are long narrow bands of airborne water vapor, providing up to half the annual precipitation and mountain snow that is key to California’s water supply. New research allows reservoir operators to use atmospheric river forecasts to better predict storm events and prevent unnecessary stored water releases.
“This stored water has helped to cope with the third driest year on record for the region,” said Ralph.
Atmospheric rivers more “impactful” with climate change
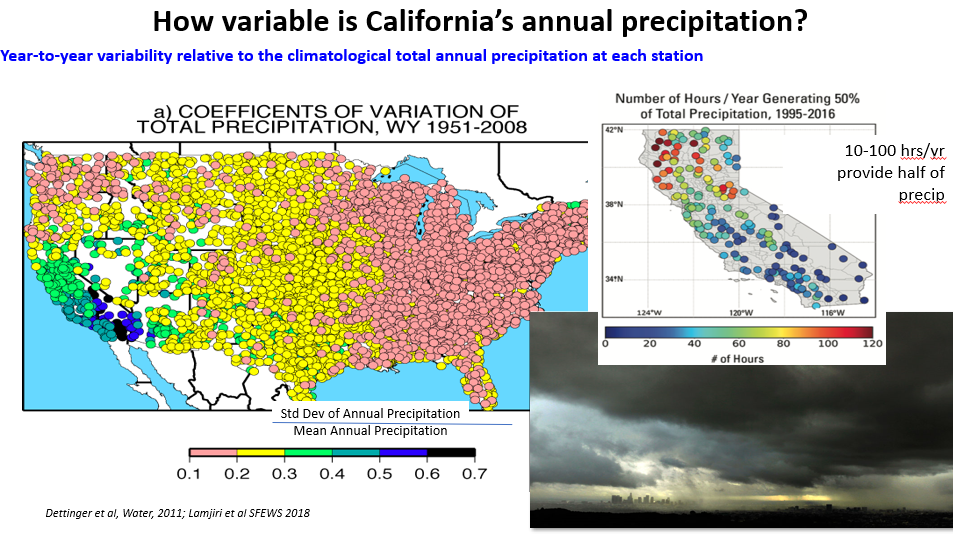
Another Scripps Institution of Oceanography researcher, Alexander “Sasha” Gershunov, said that California receives most the country’s extreme precipitation events due to atmospheric rivers. Low and medium intensity precipitation events are predicted to decrease, while high intensity precipitation events are predicted to increase, especially in California.
“With warming, atmospheric rivers get stronger, wetter, longer, and more impactful, and they also produce more of our annual precipitation total,” said Gershunov. “There are many implications of these changes from water resources management, to wildfires, to debris flows.”
San Diego Regional Climate Collaborative
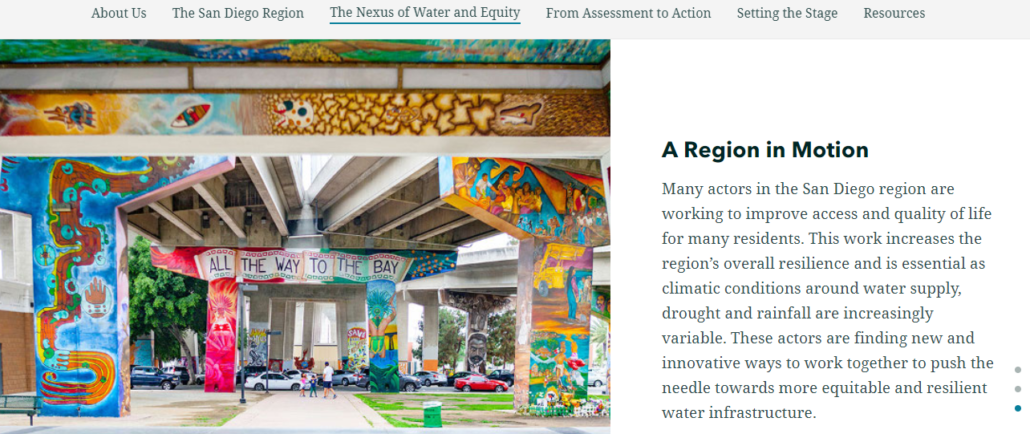
Darbi Berry, Program Manager at the San Diego Regional Climate Collaborative, described projects moving forward in the region to address equity issues related to water availability and pollution. Advancing the Nexus of Water and Equity looks at how different communities are impacted by a changing climate.
Increased variability in rainfall events and the potential for flooding in the San Diego region is a contributing factor to ongoing water quality issues in disadvantaged neighborhoods. One project carried out to address these equity issues is the National City, Paradise Creek project which re-graded a creek that was continuously overflowing and causing flood damage during atmospheric river events.
Watch the San Diego County’s Climate Future presentations by Marty Ralph, Sasha Gershunov, and by Darbi Berry here: https://bit.ly/3aBVt1Z
https://www.waternewsnetwork.com/wp-content/uploads/2021/04/Primary-WNN-NASA-atmos-river-2018-Climate-Panel.jpg450845Mike Leehttps://www.waternewsnetwork.com/wp-content/uploads/2024/04/WNN-Horizontal-White-Blue2.pngMike Lee2021-04-27 10:36:442021-04-27 13:05:52San Diego County’s Climate Future
As the planet warms, scientists expect that mountain snowpack should melt progressively earlier in the year. However, observations in the U.S. show that as temperatures have risen, snowpack melt is relatively unaffected in some regions while others can experience snowpack melt a month earlier in the year.
This discrepancy in the timing of snowpack disappearance—the date in the spring when all the winter snow has melted—is the focus of new research by scientists at Scripps Institution of Oceanography at the University of California San Diego.
In a new study published March 1 in the journal Nature Climate Change, Scripps Oceanography climate scientists Amato Evan and Ian Eisenman identify regional variations in snowpack melt as temperatures increase, and they present a theory that explains which mountain snowpacks worldwide are most “at-risk” from climate change. The study was funded by NOAA’s Climate Program Office.
Mountain snowpack changing rapidly in coastal regions
Looking at nearly four decades of observations in the Western U.S., the researchers found that as temperatures rise, the timing of snowpack disappearance is changing most rapidly in coastal regions and the south, with smaller changes in the northern interior of the country. This means that snowpack in the Sierra Nevada, the Cascades, and the mountains of southern Arizona is much more vulnerable to rising temperatures than snowpack found in places like the Rockies or the mountains of Utah.
The scientists used these historical observations to create a new model for understanding whythe timing of snowpack disappearance differs widely across mountain regions. They theorize that changes in the amount of time that snow can accumulate and the amount of time the surface is covered with snow during the year are the critical reasons why some regions are more vulnerable to snowpack melt than others.
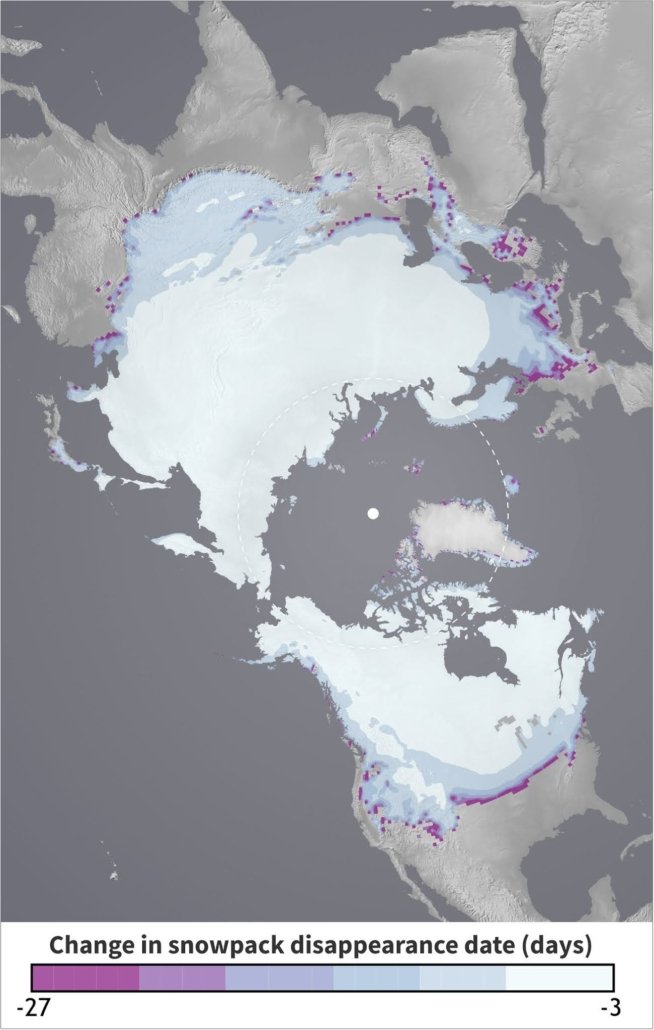
Using a new model, the Scripps researchers theorize that snowpack in coastal regions, the Arctic, and the Western U.S. may be among the most at-risk for premature melt from rising temperatures. Graphic: Courtesy Scripps Institution of Oceanography
Snowpack vulnerable due to increasing temperature
“Global warming isn’t affecting everywhere the same. As you get closer to the ocean or further south in the U.S., the snowpack is more vulnerable, or more at-risk, due to increasing temperature, whereas in the interior of the continent, the snowpack seems much more impervious, or resilient to rising temperatures,” said Evan, lead author of the study. “Our theory tells us why that’s happening, and it’s basically showing that spring is coming a lot earlier in the year if you’re in Oregon, California, Washington, and down south, but not if you’re in Colorado or Utah.”
Applying this theory globally, the researchers found that increasing temperatures would affect the timing of snowpack melt most prominently in the Arctic, the Alps of Europe, and the southern region of South America, with much smaller changes in the northern interiors of Europe and Asia, including the central region of Russia.
Climate Change and snowmelt
To devise the model that led to these findings, Evan and Eisenman analyzed daily snowpack measurements from nearly 400 sites across the Western U.S managed by the Natural Resources Conservation Service Snowpack Telemetry (SNOTEL) network. They looked at SNOTEL data each year from 1982 to 2018 and focused on changes in the date of snowpack disappearance in the spring. They also examined data from the North American Regional Reanalysis (NARR) showing the daily mean surface air temperature and precipitation over the same years for each of these stations.
Using an approach based on physics and mathematics, the model simulates the timing of snowpack accumulation and snowpack melting as a function of temperature. The scientists could then use the model to solve for the key factor that was causing the differences in snowpack warming: time. Specifically, they looked at the amount of time snow can accumulate and the amount of time the surface is covered with snow.
“I was excited by the simplicity of the explanation that we ultimately arrived at,” said Eisenman. “Our theoretical model provides a mechanism to explain why the observed snowmelt dates change so much more at some locations than at others, and it also predicts how snowmelt dates will change in the future under further warming.”
A “shrinking winter” and longer fire season
The model shows that regions with very large swings in temperature between the winter and summer are less susceptible to warming than those where the change in temperature from winter to summer is smaller. The model also shows that regions where the annual mean temperature is closest to 0˚C are less susceptible to early melt. The most susceptible regions are ones where the differences between wintertime and summertime temperatures are small, and where the average temperature is either far above, or even far below 0˚C.
For example, in an interior mountain region of the U.S. like the Colorado Rockies, where the temperature dips below 0°C for about half the year, an increase of 1°C can lead to a quicker melt by a couple of days—not a huge difference.
However, in a coastal region like the Pacific Northwest, the influence of the ocean and thermal regulation helps keep the winter temperatures a bit warmer, meaning there are fewer days below 0°C in which snow can accumulate. The researchers hypothesize that in the region’s Cascade Mountains, a 1°C increase in temperature could result in the snow melting about a month earlier in the season—a dramatic difference.
Arctic “at risk”
One of the most “at-risk” regions is the Arctic, where snow accumulates for nine months each year and takes about three months to melt. The model suggests that 1°C warming there would result in a faster melt by about a week—a significant period of time for one of the fastest warming places on Earth.
This study builds upon previous work done by Scripps scientists since the mid-1990s to map out changes in snowmelt timing and snowpacks across the Western U.S. The authors said that a “shrinking” winter—one that is shorter, warmer, and with less overall precipitation—has adverse societal effects because it contributes to a longer fire season. This could have devastating impacts on already fire-prone regions. In California, faster snowpack melt rates have already made forest management more difficult and provided prime conditions for invasive species like the bark beetle to thrive.
Funding for this work was provided by a NOAA/CPO grant to the University of California.
https://www.waternewsnetwork.com/wp-content/uploads/2021/03/DWR-27-Feb-2020-Phillips-Station-WNN.jpg451845Mike Leehttps://www.waternewsnetwork.com/wp-content/uploads/2024/04/WNN-Horizontal-White-Blue2.pngMike Lee2021-03-02 09:45:342021-03-03 18:03:19New Study Identifies Mountain Snowpack Most “At-Risk” from Climate Change

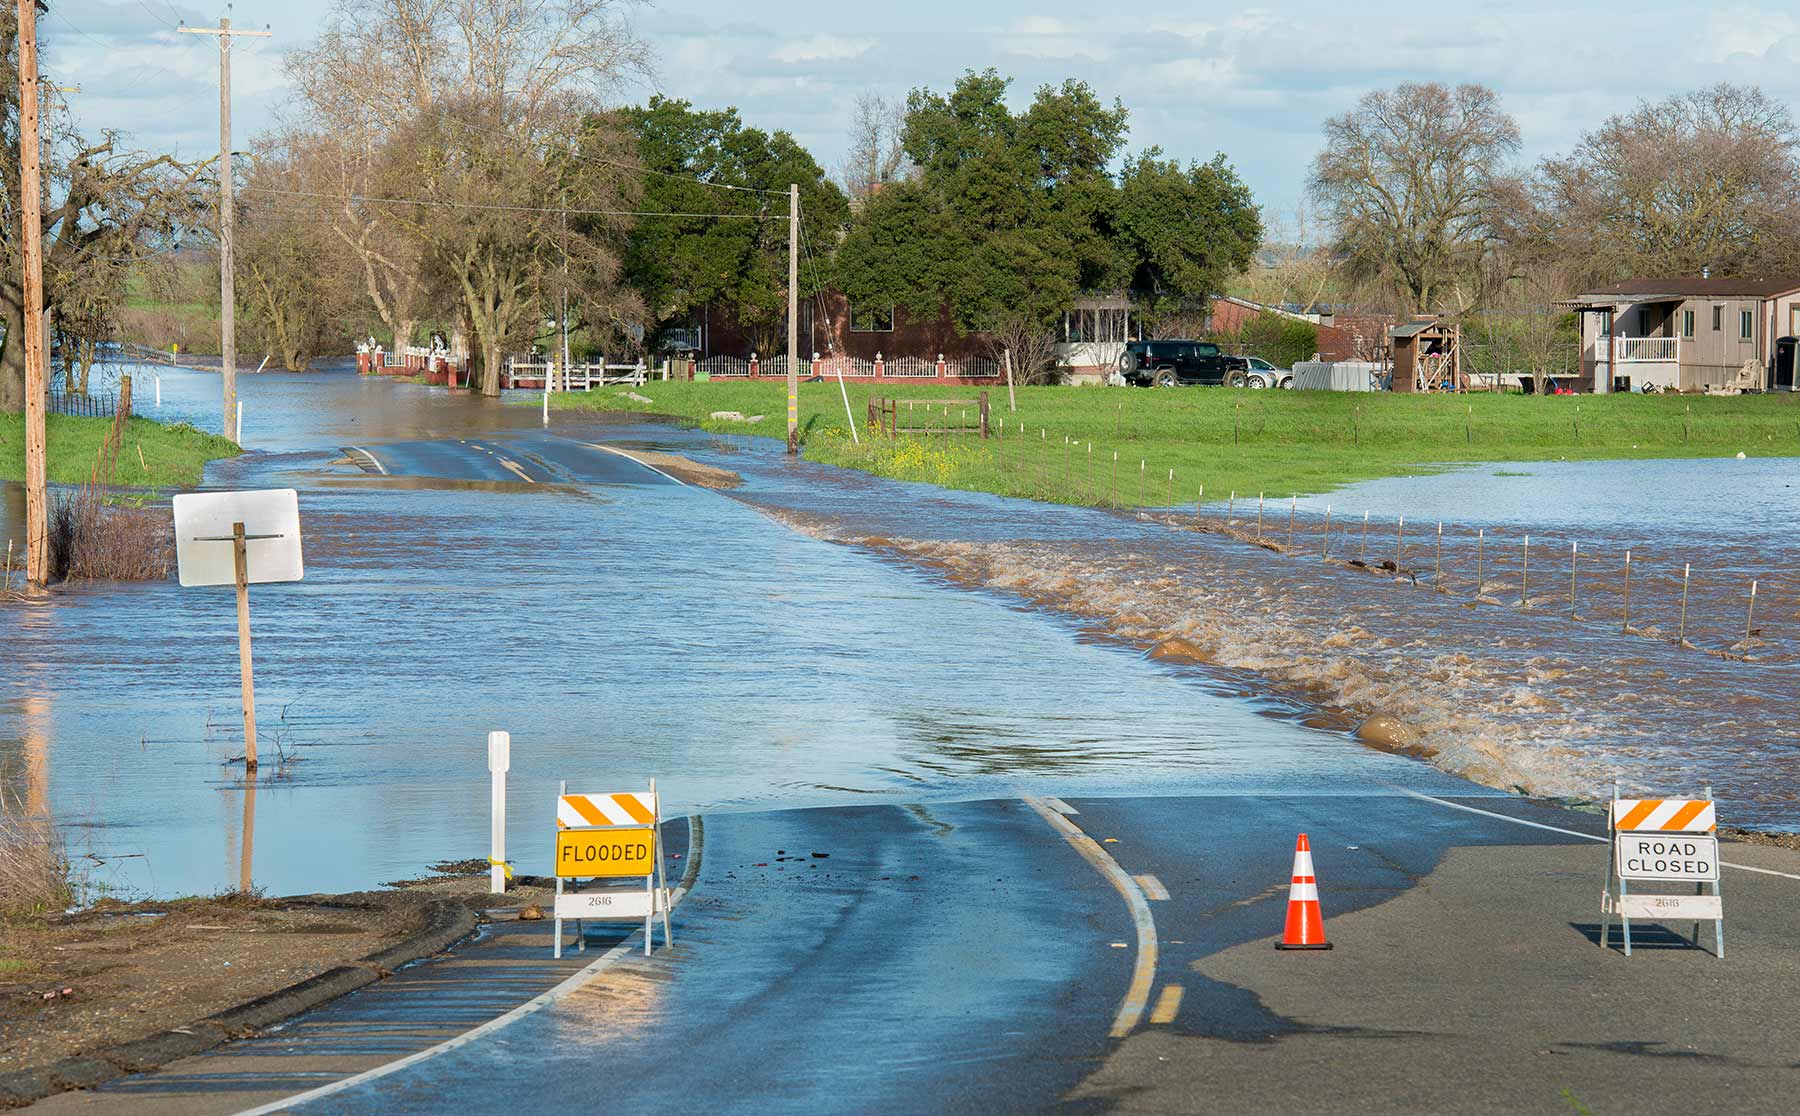 Dillard Road is flooded near the Hwy 99 off ramp, located south of Elk Grove, California. Photo credit: Florence Low / California Department of Water Resources.
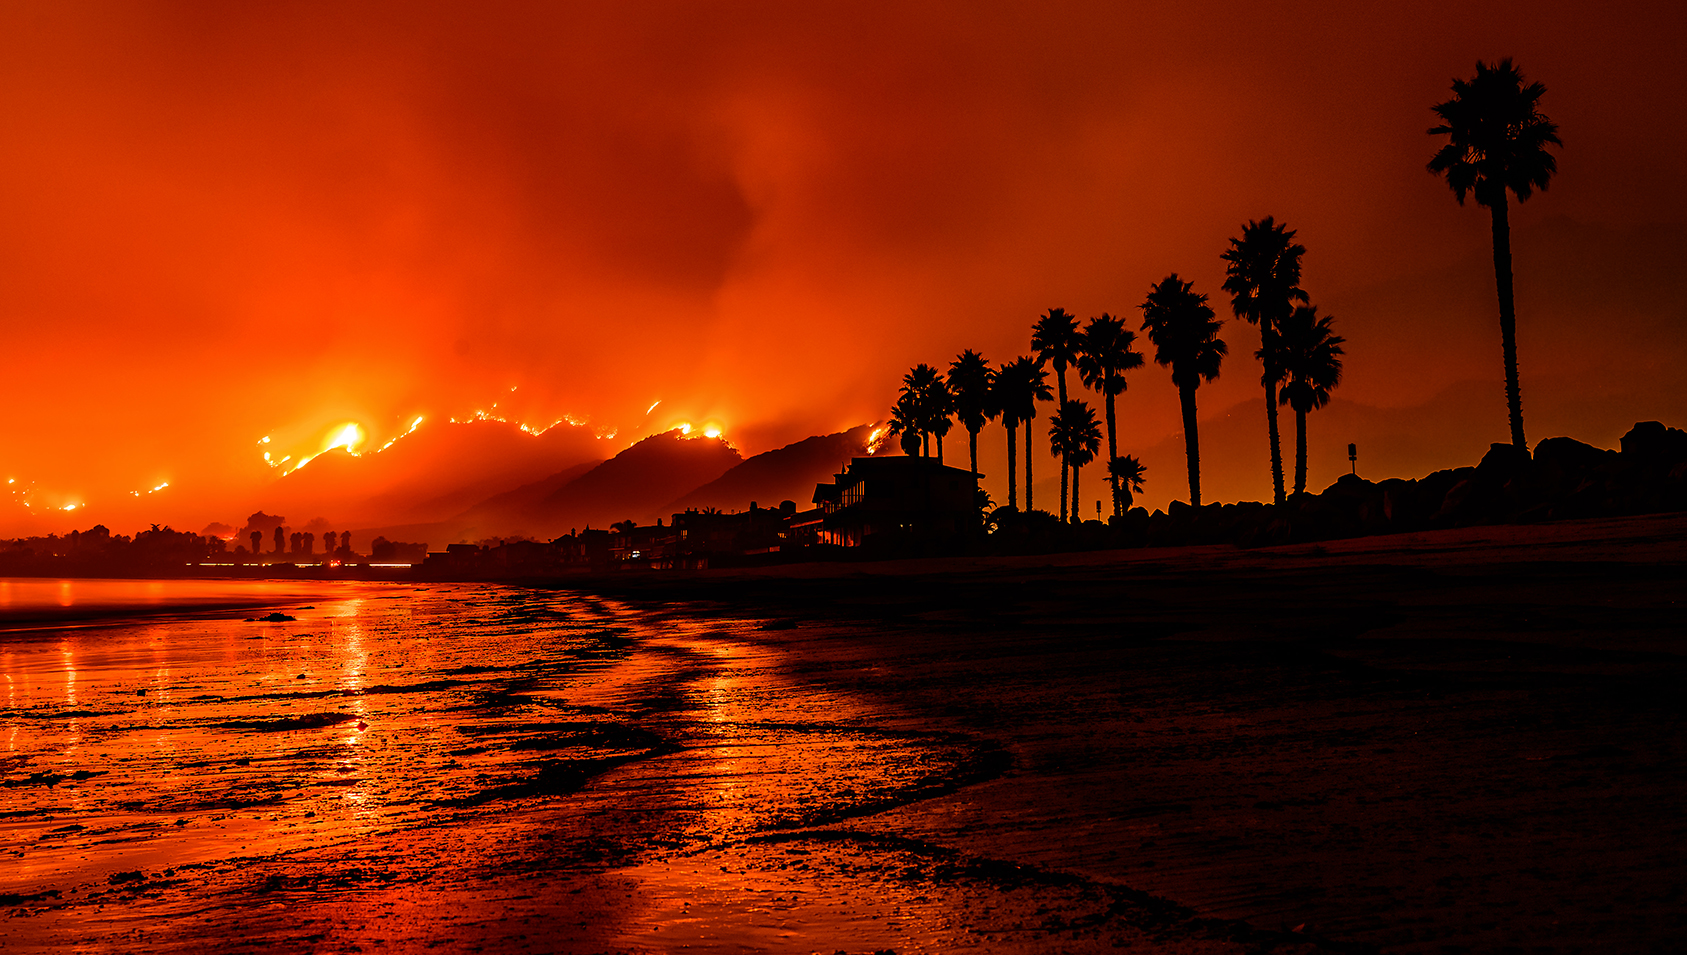 Photo of the Thomas Fire taken from a Santa Barbara beach. Photo credit: Carsten Schertzer / iStock.
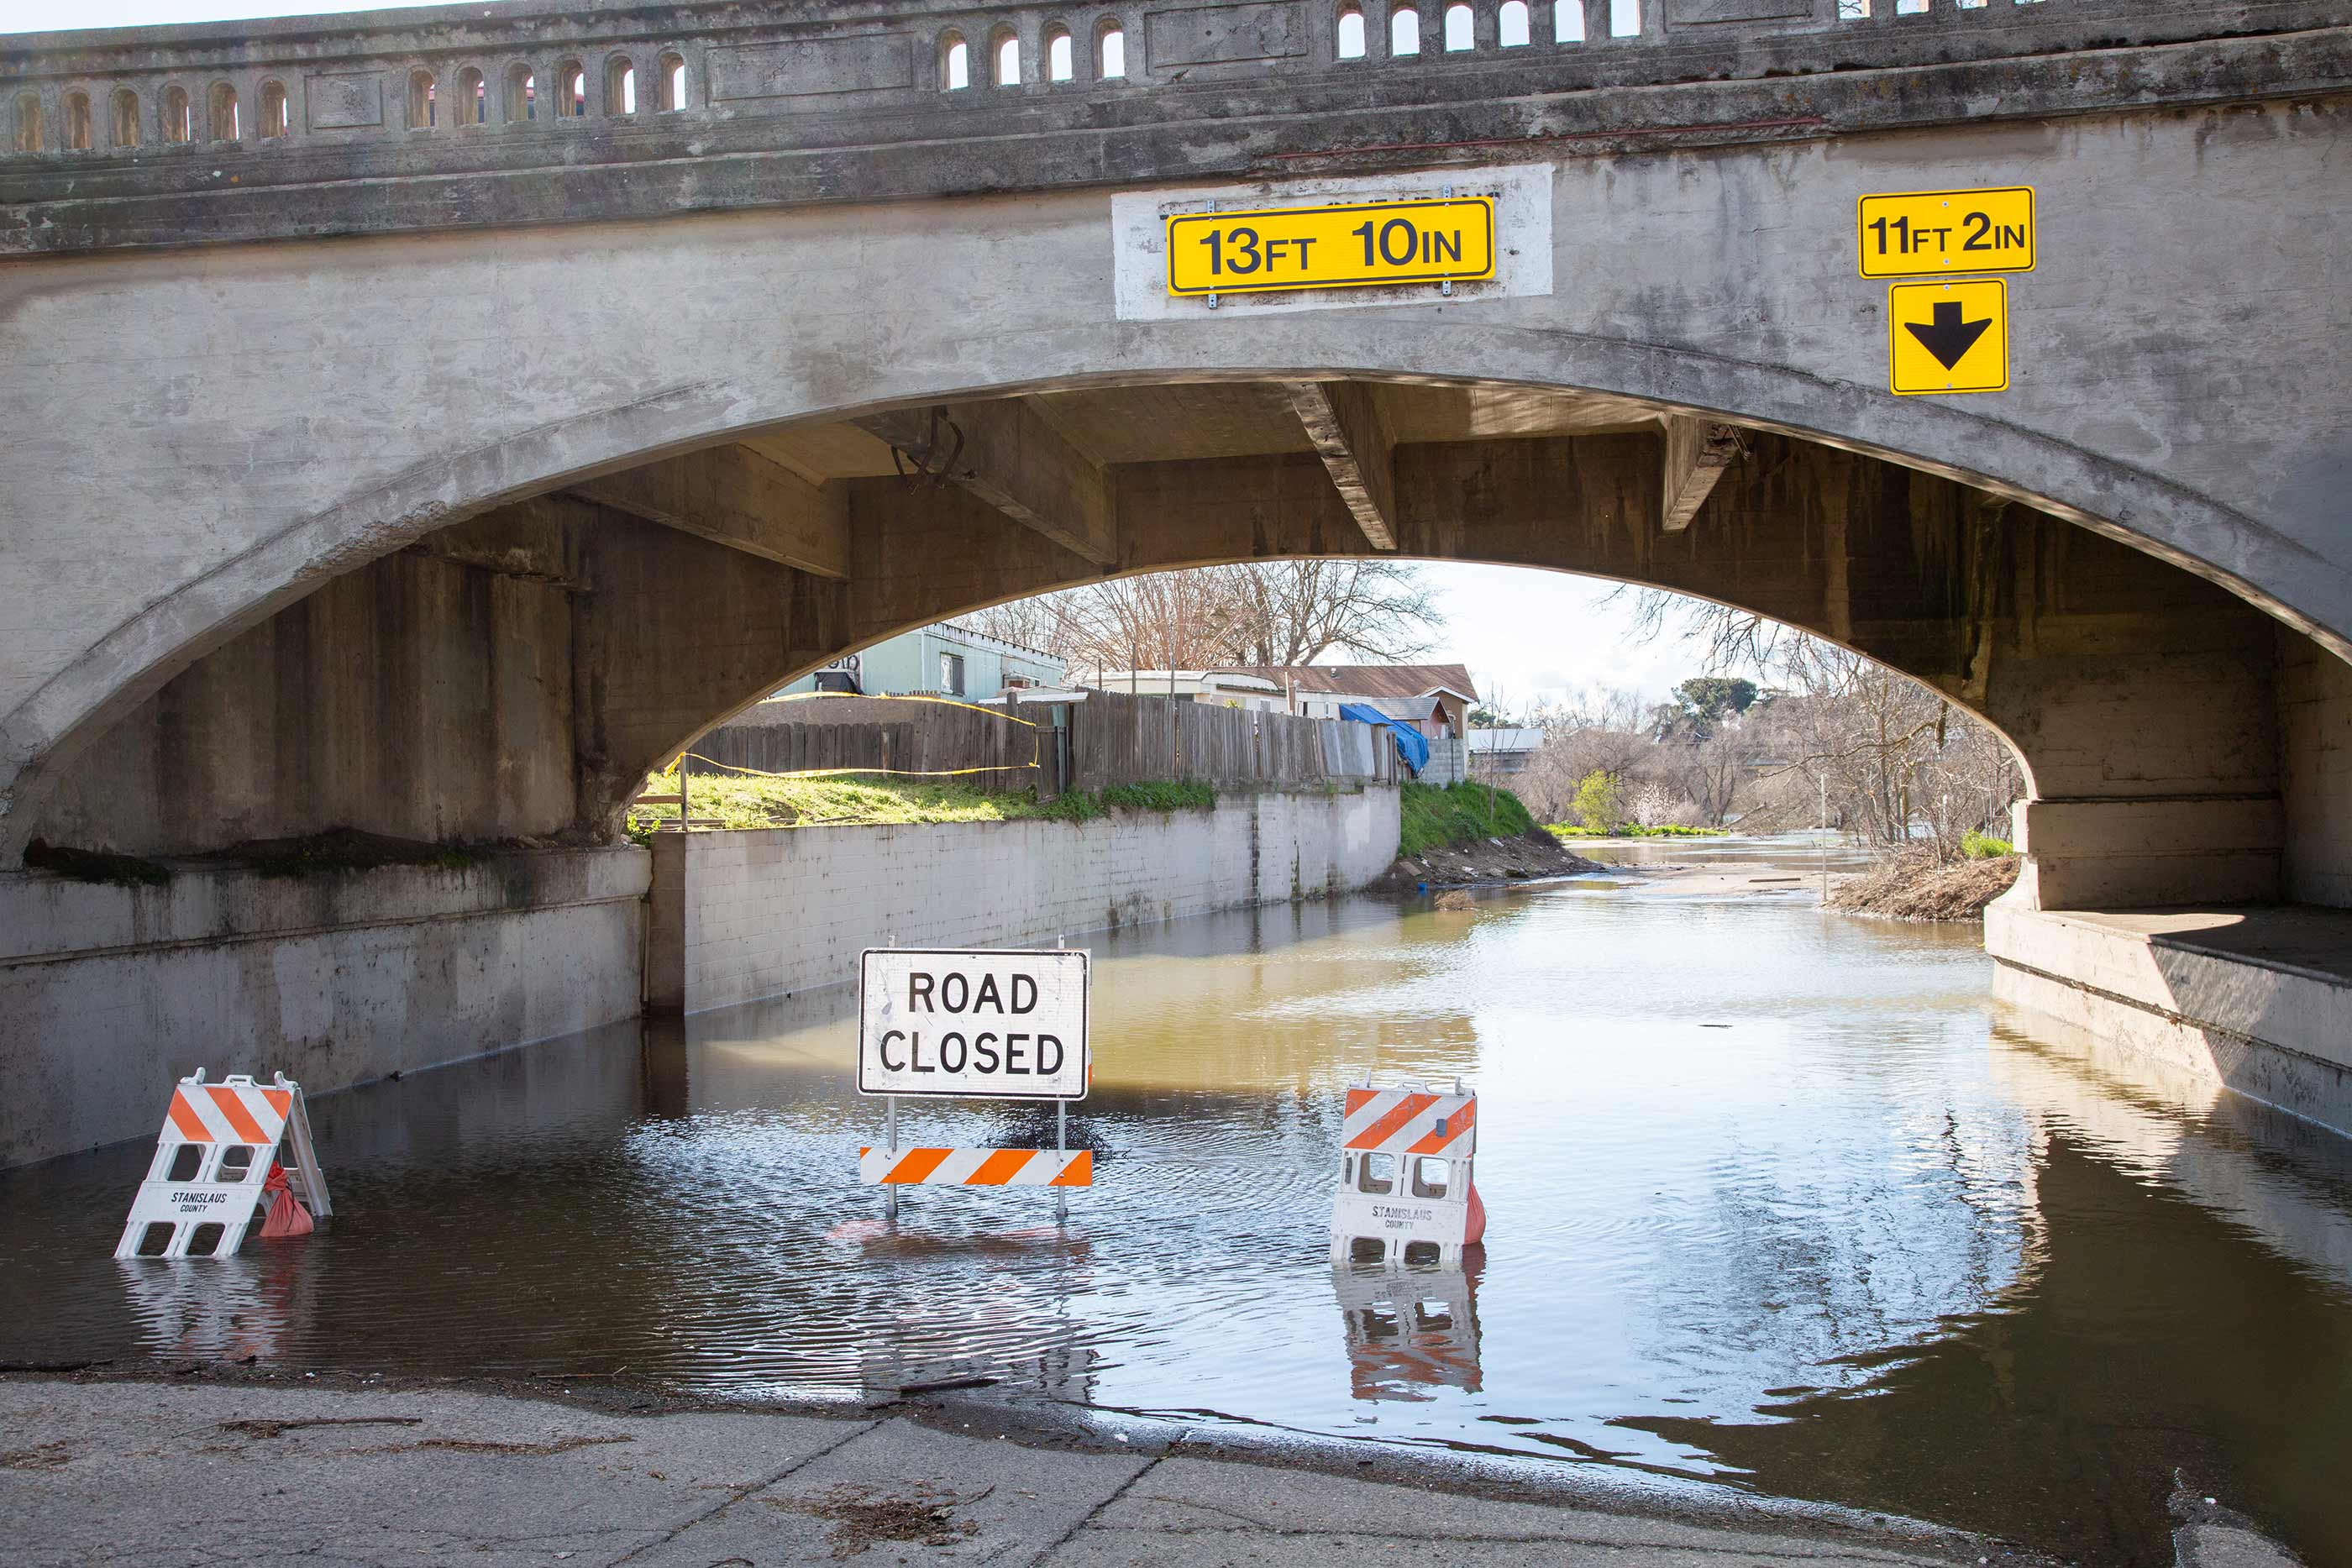 High water levels on the Tuolumne River close River Road in the city of Modesto, California, part of Stanislaus County. Photo credit: Dale Kolke / California Department of Water Resources.