Record high temperatures in urban Europe as heat waves bake the planet more often. Devastating floods, some in poorer unprepared areas. Increasing destruction from hurricanes. Drought and famine in poorer parts of Africa as dry spells worsen across the globe. Wild weather worldwide getting stronger and more frequent, resulting “in unprecedented extremes.”
Research on atmospheric rivers takes flight as UC San Diego’s Center for Western Weather and Water Extremes taps “Hurricane Hunter” aircraft for specialized scientific missions.
The aircraft will fly for a 13-week period (that began January 5) to glean critical data for improving forecasts of atmospheric river storms over the Pacific Ocean. Those storms, or “AR’s,” provide up to half of the U.S. West Coast’s annual precipitation and a majority of the flooding.
The flights are part of the Atmospheric River Reconnaissance program led by UC San Diego’s Center for Western Weather and Water Extremes (at Scripps Institution of Oceanography) with support from the U.S. Army Corps of Engineers and California Department of Water Resources. The AR Recon program works in coordination with NOAA’s Office of Marine and Aviation Operations and the U.S. Air Force Reserve 53rd Weather Reconnaissance Squadron “Hurricane Hunters” to carry out data-collecting missions within these storms.
Two Air Force Reserve WC-130J Super Hercules aircraft are on standby to fly out of Mather Air Force Base near Sacramento, when atmospheric rivers approach the West Coast. NOAA will station its Gulfstream IV-SP jet in Hawaii during this year’s operations.
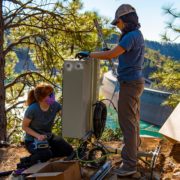
Dropsonde instruments will be deployed from these aircraft over specialized transects over atmospheric rivers, transmitting critical data on the vertical profile of water vapor, wind, and temperature carried in fast-moving, low-altitude airstreams that form the atmospheric river.
For 13 weeks, two Air Force WC-130J Super Hercules aircraft & the NOAA Gulfstream IV-SP jet will be on standby to fly over atmospheric rivers. ✈️ They’ll deploy instruments collecting data on water vapor, wind, & temp in the low-altitude airstreams over the Pacific that form ARs. pic.twitter.com/kAOKBYKSeh
— Scripps Institution of Oceanography (@Scripps_Ocean) January 12, 2022
The San Diego County Water Authority is a partner with the Scripps Institution of Oceanography, Center for Western Weather and Water Extremes, at UC San Diego, as part of the effort to better predict atmospheric rivers and improve water management before, during, and after those seasonal storms. The partnership started in 2020.
AR Forecasting and Water Supply
An average atmospheric river carries 25 times the water equivalent of the Mississippi River in the form of vapor instead of liquid. These storms can cover a swath about 500 miles wide while extending thousands of miles in length. They pack winds ranging from more than 50 miles an hour to hurricane force.
“Science has discovered that the leading source of error in predicting when and where an atmospheric river will strike the U.S. West Coast, and how much precipitation it will create, is the position and structure of the atmospheric river itself offshore, prior to landfall,” said Scripps research meteorologist and CW3E Director F. Martin Ralph. “Obtaining accurate environmental measurements in and near the atmospheric river offshore using these aircraft and drifting ocean buoys has a significant impact on forecast accuracy. AR Recon not only fills in many data gaps over the Pacific Ocean for prediction, it supports improved scientific understanding that over time improves forecasts as well. These improvements are vital for water managers and public safety.”
Ralph leads AR Recon 2022, working closely with Vijay Tallapragada, who heads modeling efforts for the National Weather Service’s Global Forecast System (GFS); and Jim Doyle, who leads the Naval Research Laboratory’s Coupled Ocean/Atmosphere Mesoscale Prediction System.
California drought cycles and ARs
Atmospheric rivers have helped break more than 40% of California’s droughts throughout recorded history. They also generate many of California’s most extreme precipitation events, driving 90% of California’s heaviest rains in bursts lasting one to three days. They are also responsible for as much as $1 billion a year in flood damages in western states.
California’s climate variability
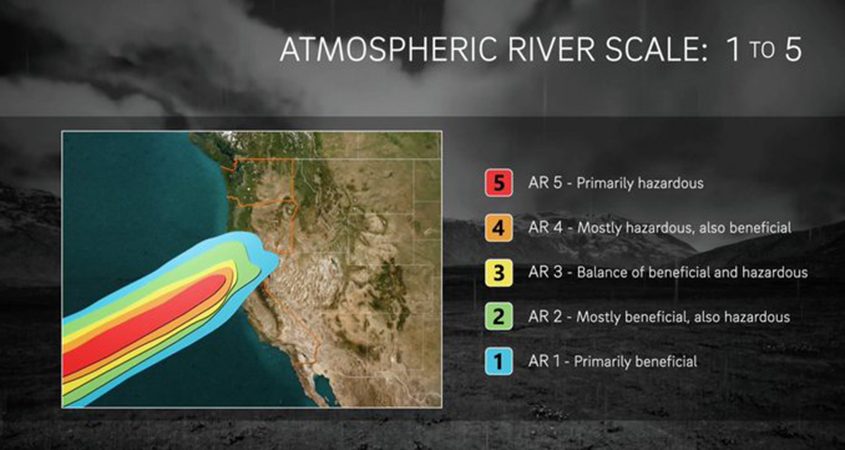
Although meteorologists can see atmospheric rivers forming as much as eight days in advance, landfall forecasts can be hundreds of miles off target. AR Recon data improves forecasts of their intensity, allowing forecasters to more precisely determine the potential benefits or hazards of atmospheric rivers. Situationally, they can refill reservoirs or bring flooding and debris flows. Real-time data will also be incorporated into AR scale rankings, which can serve as a predictive indicator of the storm’s damage or benefit.
“AR Recon has been a key monitoring element of the State’s Atmospheric River Research Program and is a great example of collaborative engagements that lead to improvements in precipitation prediction, providing multiple benefits to water managers seeking to understand climate change-caused weather extremes,” said Michael Anderson, state climatologist with the California Department of Water Resources.
As California alternates between extremes of drought and flood, accurate forecasts are increasingly vital to water managers. A collaborative program called Forecast-Informed Reservoir Operations (FIRO) uses modern forecasting methods to give reservoir operators better decision-making tools to optimize water resources. FIRO is developing the capability for these advanced forecasts to help water managers decide whether to retain water if no additional storms are forecast or release it to mitigate the risk of flooding.
Atmospheric river research helps forecasting, water management
“Research on atmospheric rivers from the Atmospheric River Reconnaissance program has helped us better predict, mitigate, and optimize these weather events in California,” said U.S. Sen. Dianne Feinstein (D-CA). “Applying this data through Forecast-Informed Reservoir Operations means better flood protection and improved water storage to help lessen the effects of drought.”
“Water managers within the U.S. Army Corps of Engineers have long maintained that they can do a better job of making water management decisions if weather forecasts were better – i.e. more accurate at longer lead times,” said Cary Talbot, chief of the Flood and Storm Protection Division at the U.S. Army Engineer Research and Development Center. “The AR Recon program, combined with the increased flexibility afforded by the FIRO program, is making better water management a reality in California and across the West because the forecasts are improving in both accuracy and lead time.”
AR Recon observations began in 2016. This year the mission window will expand to 13 weeks, three weeks longer than last year.
In addition to using dropsondes, the Air Force Reserves and ships of opportunity deployed 50 additional drifting buoys in key locations throughout the northeast Pacific this season, joining 48 buoys active from previous seasons. These buoys provide vital sea-level pressure, water temperature, and wave measurements from a region lacking data needed for numerical weather predictions and climate studies. The buoy deployments were completed in partnership with the Scripps-based, NOAA-funded Global Drifter Program (GDP), the California Department of Water Resources, and the U.S. Army Corps of Engineers.
Data gathering using GPS signals
Air Force Reserve aircraft will also be equipped with what are known as airborne radio occultation capabilities. Proven on NOAA’s Gulfstream IV-SP platform in previous seasons, the airborne radio occultation technique uses GPS signals to detect variations in atmospheric properties and provide critical moisture and temperature profiles in the larger environment surrounding the aircraft, complementing the dropsondes.
Neither satellites nor other conventional observation methods can detect conditions captured from buoys and dropsondes. In offshore areas from the ground to a height of several miles, AR Recon dropsonde data account for most temperature and humidity observations and almost half of the wind observations. These data plug a serious gap in the standard network of weather observations impacting the U.S. mainland.
Weather officers and navigators of the U.S. Air Force Reserves will embed at Scripps Oceanography for flight planning this season, assisted by a team from NOAA’s Environmental Modeling Center and flight directors from NOAA’s Aircraft Operations Center. About 50 people aid flight planning throughout the season, including approximately 20 from Scripps Oceanography and up to 15 from the Air Force Reserves.
The AR Recon Program has grown from a demonstration phase in 2016 to an operational requirement in 2019 and is now included in the federal National Winter Season Operational Plan. It has expanded from flying three storm Intense Observation Periods in 2016 to 30 such periods in 2021, with more than 117 aircraft missions flown and data from more than 3,000 dropsondes assimilated in real-time operations.
AR Recon data used for global weather models
Leading global weather models at NOAA and the National Weather Service, the U.S. Navy, and European agencies and others incorporate AR Recon data into their forecasts. In the northeast Pacific, AR Recon observations have improved precipitation forecasts over the western United States. They also provide a more accurate analysis of upstream atmospheric conditions before potential high-impact weather events develop over the central and eastern parts of the country.
“Real-time assimilation of AR Recon observations have made a significant impact on NOAA’s operational GFS, particularly for the precipitation forecasts along the west coast of the United States, with forecast improvements exceeding 20-30 percent in areas where heavy precipitation occurs due to landfalling atmospheric rivers,” said Vijay Tallapragada, Chief of Modeling and Data Assimilation Branch at NOAA’s Environmental Modeling Center.
The Research and Operations partnership established through the AR Recon Program has enabled scientists from NOAA working closely with CW3E and the Navy in developing advanced sampling strategies for mission planning and targeted collection of observations critical for improving the analysis and forecasts. The AR Recon observations also have notably improved key aspects of NOAA’s GFS. Wind forecasts alone have improved by 17% after including AR Recon data. The Navy has found that AR Recon data improves forecasts as much as all the data collected from balloon-borne radiosondes in North America.
The recent report from NOAA’s Science Advisory Board on Priorities for Weather Research explicitly recommended the implementation of a multi-phase program to improve atmospheric river forecasting to better anticipate and mitigate extreme precipitation swings and their cascading impacts.
In 2022, the AR Recon Program will include, for the first time, real-time data collection and feedback that can instantly impact experiments being carried out with NOAA’s GFS. Making this possible are the computational resources provided by San Diego Supercomputer Center’s “COMET” to facilitate documenting the forecast improvements and support mission planning.
(Editor’s Note: Follow the work of Scripps Institution of Oceanography scientists at the Center for Western Weather and Water Extremes on Twitter at @CW3E_Scripps, the U.S. Air Force Reserves Weather Reconnaissance Squadron at @53rdWRS, and NOAA Aircraft Operations Center at @NOAA_HurrHunter.)
https://www.waternewsnetwork.com/wp-content/uploads/2022/01/AR-Research-SIO-Primary-Yuba-Water-Agency-SIO.jpg450845Mike Leehttps://www.waternewsnetwork.com/wp-content/uploads/2024/04/WNN-Horizontal-White-Blue2.pngMike Lee2022-01-13 16:52:352022-07-07 13:07:54Atmospheric River Storm Observations Take Flight Over Pacific Ocean
Every winter, Imperial Beach finds some of its streets and sidewalks underwater. This week, researchers from San Diego State and UC San Diego started digging groundwater wells to see how sea-level rise plays a role in that flooding. The sea-level impacts how shallow the water table is underneath the city.
“Flooding overall is a very, very big thing in Imperial Beach,” said Hassan Davani, Ph.D.
The SDSU researcher said most studies predict sea-level rise will significantly impact California as early as 2050. However, Davani said Imperial Beach can’t wait that long to protect itself.
This happens regularly in the @CityofIB. A study is underway to figure out how to stop flooding in the future, especially if the sea level keeps rising. @nbcsandiego at 4:30 and 6:00. pic.twitter.com/d8cz7ZDERY
https://www.waternewsnetwork.com/wp-content/uploads/2024/04/WNN-Horizontal-White-Blue2.png00Mike Leehttps://www.waternewsnetwork.com/wp-content/uploads/2024/04/WNN-Horizontal-White-Blue2.pngMike Lee2021-12-03 09:46:192021-12-03 16:00:39Researchers Work to Keep Imperial Beach Above Water
President Joe Biden’s fiscal 2022 budget lays out a 24.1% boost to the EPA’s core rule-writing and enforcement programs and a 7.5% increase in staffing to get the work done, according to a detailed blueprint released on Friday.
The plan envisions a $3.4 billion request to implement the Environmental Protection Agency’s Clean Air Act, Clean Water Act, and other statutes, up from $2.8 billion in the current budget. That funding would cover a huge range of activities, such as creating ways to attain ambient air quality standards and overseeing states’ management of hazardous waste.
https://www.waternewsnetwork.com/wp-content/uploads/2024/04/WNN-Horizontal-White-Blue2.png00Kristiene Gonghttps://www.waternewsnetwork.com/wp-content/uploads/2024/04/WNN-Horizontal-White-Blue2.pngKristiene Gong2021-06-01 10:18:192021-06-01 10:40:00Biden Budget Seeks Boost for EPA Core Programs and Research
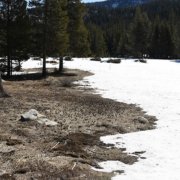
As the planet warms, scientists expect that mountain snowpack should melt progressively earlier in the year. However, observations in the U.S. show that as temperatures have risen, snowpack melt is relatively unaffected in some regions while others can experience snowpack melt a month earlier in the year.
This discrepancy in the timing of snowpack disappearance—the date in the spring when all the winter snow has melted—is the focus of new research by scientists at Scripps Institution of Oceanography at the University of California San Diego.
In a new study published March 1 in the journal Nature Climate Change, Scripps Oceanography climate scientists Amato Evan and Ian Eisenman identify regional variations in snowpack melt as temperatures increase, and they present a theory that explains which mountain snowpacks worldwide are most “at-risk” from climate change. The study was funded by NOAA’s Climate Program Office.
Mountain snowpack changing rapidly in coastal regions
Looking at nearly four decades of observations in the Western U.S., the researchers found that as temperatures rise, the timing of snowpack disappearance is changing most rapidly in coastal regions and the south, with smaller changes in the northern interior of the country. This means that snowpack in the Sierra Nevada, the Cascades, and the mountains of southern Arizona is much more vulnerable to rising temperatures than snowpack found in places like the Rockies or the mountains of Utah.
The scientists used these historical observations to create a new model for understanding whythe timing of snowpack disappearance differs widely across mountain regions. They theorize that changes in the amount of time that snow can accumulate and the amount of time the surface is covered with snow during the year are the critical reasons why some regions are more vulnerable to snowpack melt than others.
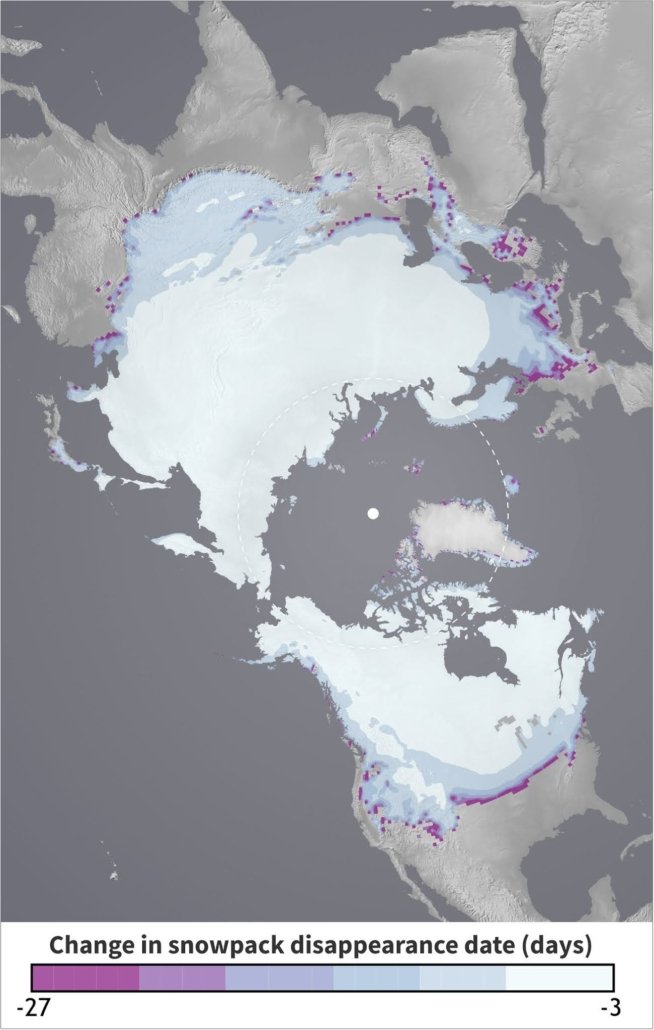
Using a new model, the Scripps researchers theorize that snowpack in coastal regions, the Arctic, and the Western U.S. may be among the most at-risk for premature melt from rising temperatures. Graphic: Courtesy Scripps Institution of Oceanography
Snowpack vulnerable due to increasing temperature
“Global warming isn’t affecting everywhere the same. As you get closer to the ocean or further south in the U.S., the snowpack is more vulnerable, or more at-risk, due to increasing temperature, whereas in the interior of the continent, the snowpack seems much more impervious, or resilient to rising temperatures,” said Evan, lead author of the study. “Our theory tells us why that’s happening, and it’s basically showing that spring is coming a lot earlier in the year if you’re in Oregon, California, Washington, and down south, but not if you’re in Colorado or Utah.”
Applying this theory globally, the researchers found that increasing temperatures would affect the timing of snowpack melt most prominently in the Arctic, the Alps of Europe, and the southern region of South America, with much smaller changes in the northern interiors of Europe and Asia, including the central region of Russia.
Climate Change and snowmelt
To devise the model that led to these findings, Evan and Eisenman analyzed daily snowpack measurements from nearly 400 sites across the Western U.S managed by the Natural Resources Conservation Service Snowpack Telemetry (SNOTEL) network. They looked at SNOTEL data each year from 1982 to 2018 and focused on changes in the date of snowpack disappearance in the spring. They also examined data from the North American Regional Reanalysis (NARR) showing the daily mean surface air temperature and precipitation over the same years for each of these stations.
Using an approach based on physics and mathematics, the model simulates the timing of snowpack accumulation and snowpack melting as a function of temperature. The scientists could then use the model to solve for the key factor that was causing the differences in snowpack warming: time. Specifically, they looked at the amount of time snow can accumulate and the amount of time the surface is covered with snow.
“I was excited by the simplicity of the explanation that we ultimately arrived at,” said Eisenman. “Our theoretical model provides a mechanism to explain why the observed snowmelt dates change so much more at some locations than at others, and it also predicts how snowmelt dates will change in the future under further warming.”
A “shrinking winter” and longer fire season
The model shows that regions with very large swings in temperature between the winter and summer are less susceptible to warming than those where the change in temperature from winter to summer is smaller. The model also shows that regions where the annual mean temperature is closest to 0˚C are less susceptible to early melt. The most susceptible regions are ones where the differences between wintertime and summertime temperatures are small, and where the average temperature is either far above, or even far below 0˚C.
For example, in an interior mountain region of the U.S. like the Colorado Rockies, where the temperature dips below 0°C for about half the year, an increase of 1°C can lead to a quicker melt by a couple of days—not a huge difference.
However, in a coastal region like the Pacific Northwest, the influence of the ocean and thermal regulation helps keep the winter temperatures a bit warmer, meaning there are fewer days below 0°C in which snow can accumulate. The researchers hypothesize that in the region’s Cascade Mountains, a 1°C increase in temperature could result in the snow melting about a month earlier in the season—a dramatic difference.
Arctic “at risk”
One of the most “at-risk” regions is the Arctic, where snow accumulates for nine months each year and takes about three months to melt. The model suggests that 1°C warming there would result in a faster melt by about a week—a significant period of time for one of the fastest warming places on Earth.
This study builds upon previous work done by Scripps scientists since the mid-1990s to map out changes in snowmelt timing and snowpacks across the Western U.S. The authors said that a “shrinking” winter—one that is shorter, warmer, and with less overall precipitation—has adverse societal effects because it contributes to a longer fire season. This could have devastating impacts on already fire-prone regions. In California, faster snowpack melt rates have already made forest management more difficult and provided prime conditions for invasive species like the bark beetle to thrive.
Funding for this work was provided by a NOAA/CPO grant to the University of California.
https://www.waternewsnetwork.com/wp-content/uploads/2021/03/DWR-27-Feb-2020-Phillips-Station-WNN.jpg451845Mike Leehttps://www.waternewsnetwork.com/wp-content/uploads/2024/04/WNN-Horizontal-White-Blue2.pngMike Lee2021-03-02 09:45:342021-03-03 18:03:19New Study Identifies Mountain Snowpack Most “At-Risk” from Climate Change
An enormous ocean current that flows between continents in a worldwide circuit that can take centuries to complete is slowing down, scientists say. And climate change may be partly to blame.
New research finds that the Atlantic Meridional Overturning Circulation, or AMOC — a major ocean system that ferries water and heat between the equator and the poles — is at its weakest point in more than a thousand years.
https://www.waternewsnetwork.com/wp-content/uploads/2024/04/WNN-Horizontal-White-Blue2.png00Mike Leehttps://www.waternewsnetwork.com/wp-content/uploads/2024/04/WNN-Horizontal-White-Blue2.pngMike Lee2021-02-26 10:22:072021-02-26 15:03:37Current Steering Weather Hits Slowest Speed in 1,000 Years
The biologists working in a fish hatchery near Shasta Dam grew increasingly concerned last year when newly hatched salmon fry began to act strangely — swimming around and around, in tight, corkscrewing motions, before spiraling to their deaths at the bottom of the tanks.
Certain runs of chinook salmon in California are imperiled; the hatcheries and the fry raised there are the federal government’s last-ditch effort to sustain these ecologically and economically vital fish populations.
https://www.waternewsnetwork.com/wp-content/uploads/2024/04/WNN-Horizontal-White-Blue2.png00Chelsea Camposhttps://www.waternewsnetwork.com/wp-content/uploads/2024/04/WNN-Horizontal-White-Blue2.pngChelsea Campos2021-01-27 10:05:012021-01-27 10:05:01Something was Killing Baby Salmon. Scientists Traced it to a Food-Web Mystery
UC San Diego will receive a $39 million grant to build a testbed to allow universities, utilities and industry leaders to gain a better understanding of how to integrate renewable energy resources into the power grid, it was announced Monday.
https://www.waternewsnetwork.com/wp-content/uploads/2024/04/WNN-Horizontal-White-Blue2.png00Mike Leehttps://www.waternewsnetwork.com/wp-content/uploads/2024/04/WNN-Horizontal-White-Blue2.pngMike Lee2020-11-03 09:43:532020-11-06 16:22:36UCSD Gets $39 Million Grant for Renewable Energy Testbed
Amid a record-breaking fire year, a new report out Thursday says the state lacks a grasp on the true costs of wildfires. The report is from the California Council on Science and Technology, an independent nonprofit organization established to offer state leaders objective advice from scientists and research institutions.
https://www.waternewsnetwork.com/wp-content/uploads/2024/04/WNN-Horizontal-White-Blue2.png00Kimberlyn Velasquezhttps://www.waternewsnetwork.com/wp-content/uploads/2024/04/WNN-Horizontal-White-Blue2.pngKimberlyn Velasquez2020-10-29 09:55:462020-10-30 10:55:01California Could Do Better to Ease the Burdens of Wildfires If We Knew How Much They Actually Cost
As the beginning of the school year nears, the university is preparing to ramp up its testing of sewage for the coronavirus. The goal: Monitor the progress of the pandemic on campus and catch outbreaks before it’s too late to control them. Along those lines, UCSD on Saturday sent out its first campus-wide email alert about the detection of the virus in sewage from one of its seven colleges.
https://www.waternewsnetwork.com/wp-content/uploads/2024/04/WNN-Horizontal-White-Blue2.png00Mike Leehttps://www.waternewsnetwork.com/wp-content/uploads/2024/04/WNN-Horizontal-White-Blue2.pngMike Lee2020-09-08 09:20:382020-09-11 09:53:37A New Kind of College Exam: UCSD is Testing Sewage for COVID-19