Posts

El Niño-climate change-UC San Diego-Scripps Institution of Oceanography

What is El Niño?

El Niño and La Niña are natural climate phenomena that alter weather patterns around the world. El Niño occurs irregularly but shows up roughly every three to seven years and typically lasts between nine and 12 months with occasional exceptions that linger for multiple years.

After three successive years of La Niña (2020-2023), the National Oceanic and Atmospheric Administration (NOAA) and the National Weather Service (NWS) have officially declared an El Niño event that is expected to continue and intensify into winter. As of this writing, the forecast predicts this year’s El Niño is likely to be of moderate strength and is unlikely to be as intense as the 2015-2016 event.

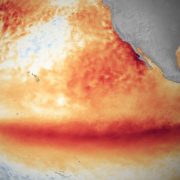
El Niño’s effects are powerful. Its ocean warming is enough to drive average global temperatures higher, and to temporarily raise sea levels along the California coast via thermal expansion – offering humanity a glimpse of conditions that are projected to become the norm in coming decades as climate change accelerates.

To learn more, we asked experts from UC San Diego’s Scripps Institution of Oceanography to answer some common questions about El Niño and its impacts.

El Niño-UC San Diego-Scripps Institution of Oceanography-weather-Climate Change

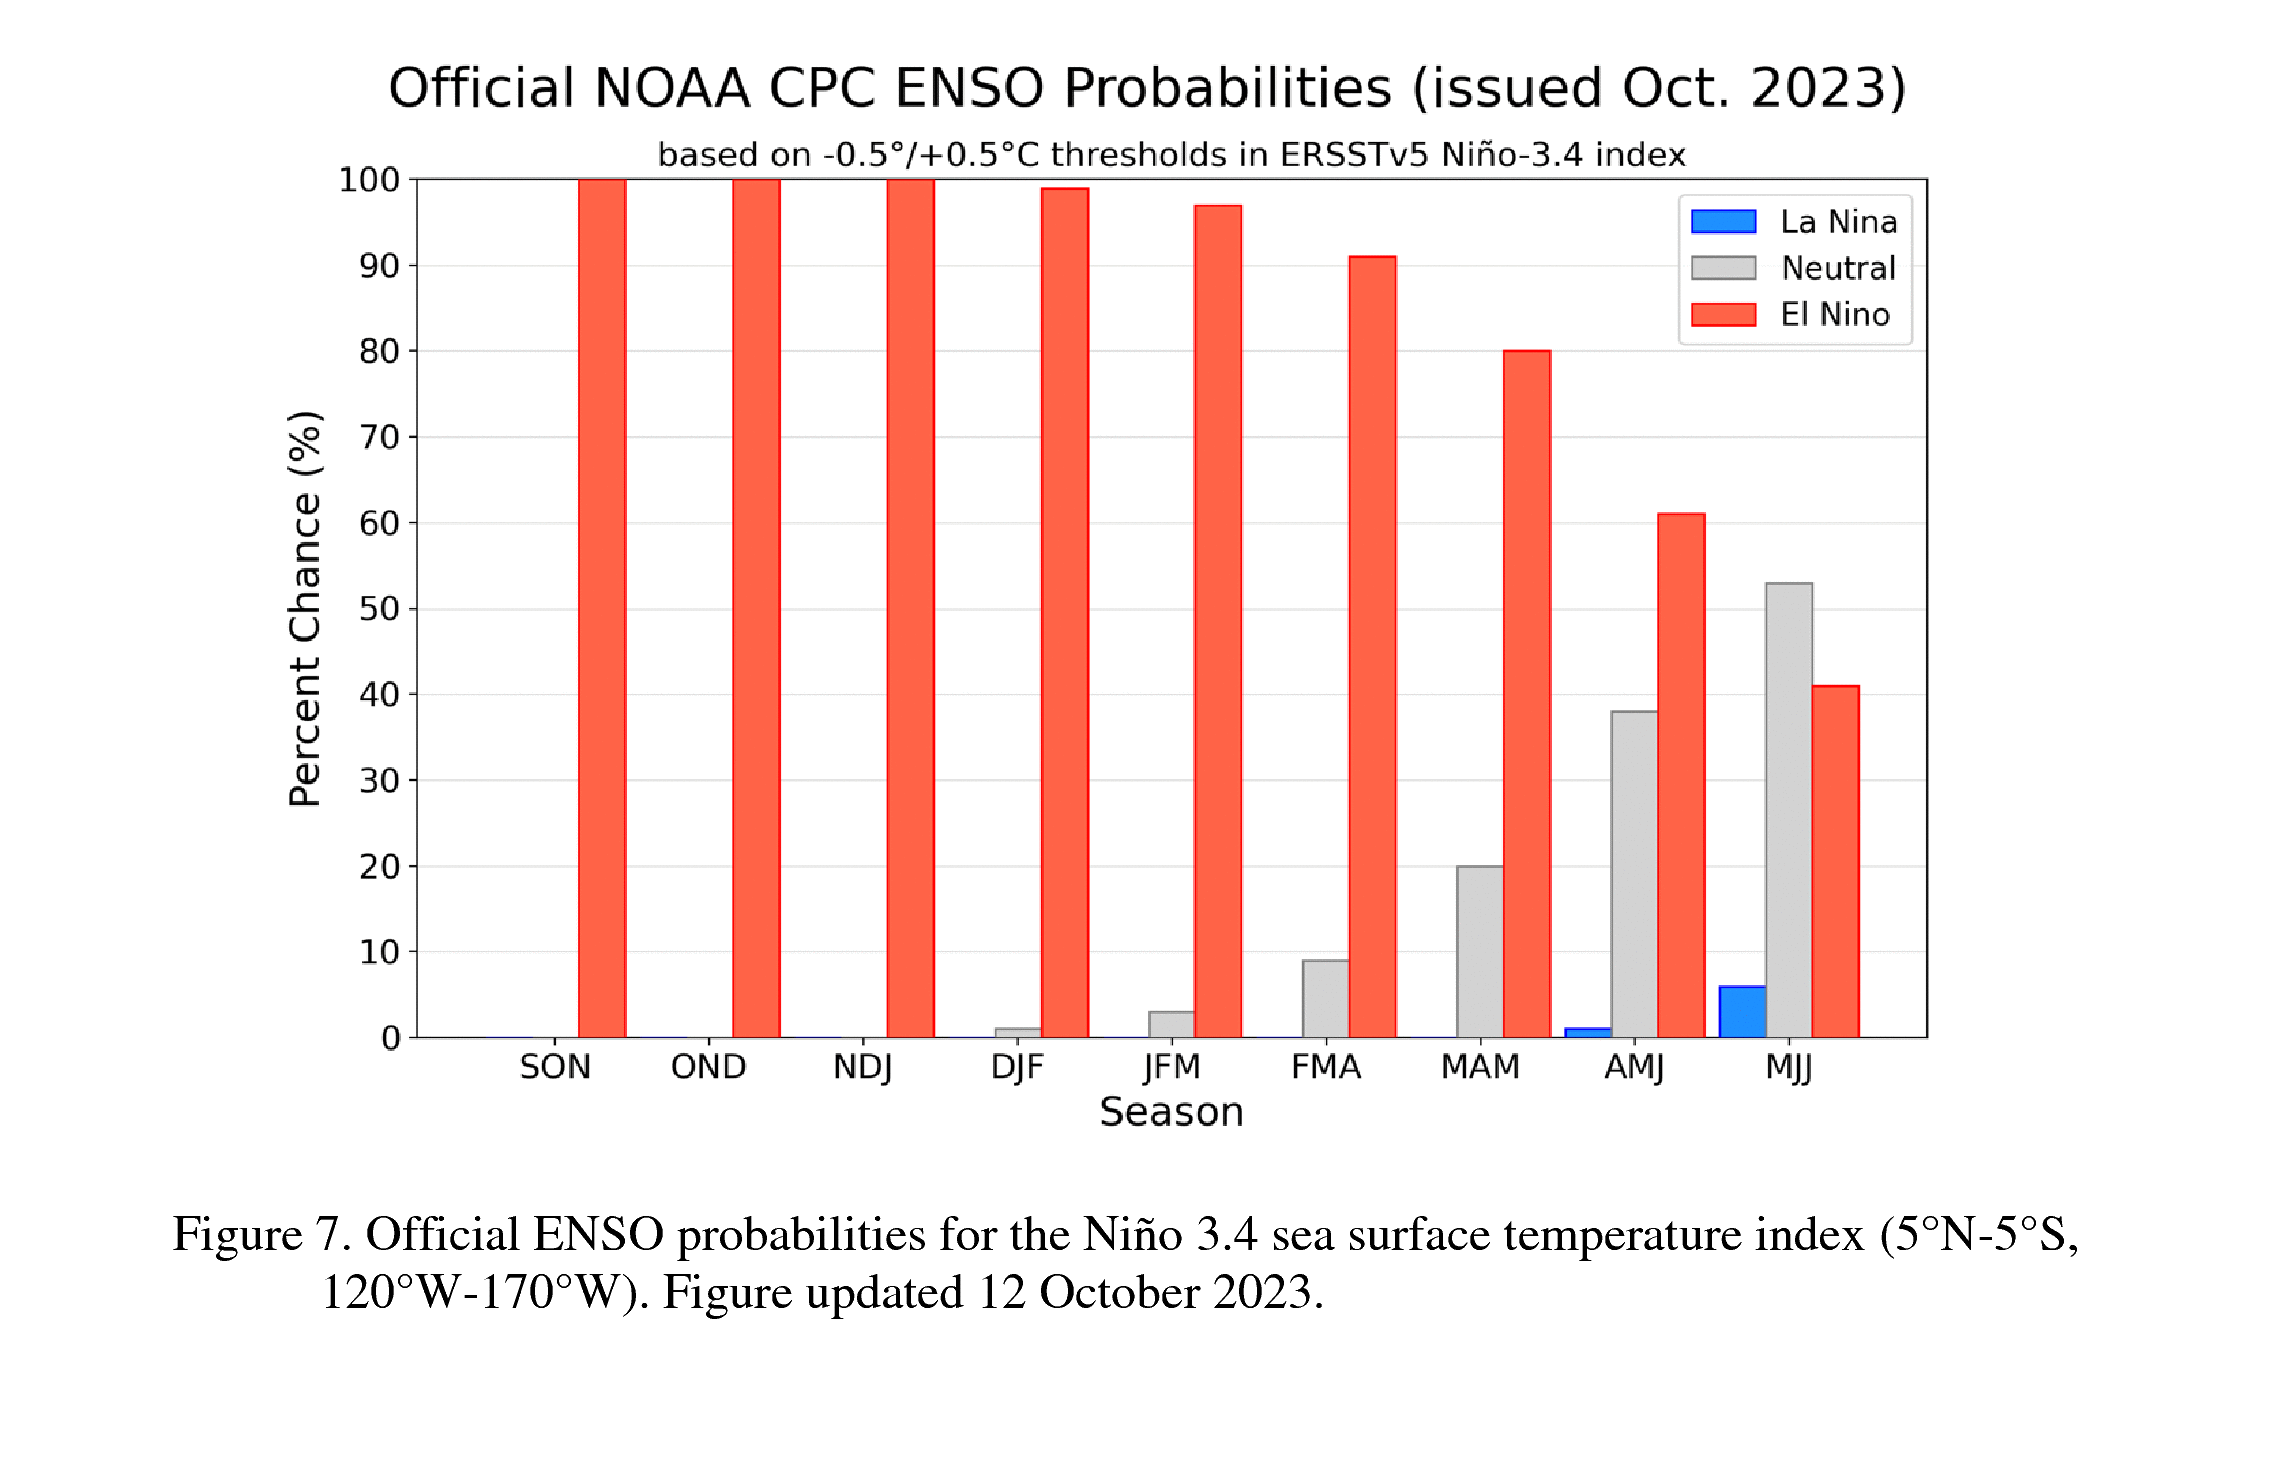
El Niño is anticipated to continue through the Northern Hemisphere spring (with an 80% chance during March-May 2024). An El Niño Advisory remains in effect. Graphic: NWS Climate Prediction Center

Scripps Oceanography experts explain phenomenon and its global impacts

Shang-Ping Xie (Professor of Climate Science and Physical Oceanography, Roger Revelle Chair in Environmental Science): El Niño refers to anomalously warm waters in the central and eastern Pacific Ocean near the equator. La Niña is the opposite–colder than average water temperatures in the equatorial Pacific.

The tropics are like the engine room of the Pacific. Heat in the tropics drives global atmospheric circulation. In that sense, variations in the tropical Pacific like El Niño can have huge impacts on global weather patterns.

What causes El Niño?

Shang-Ping Xie: El Niño and La Niña are the result of complex interactions between the ocean and the atmosphere.

The trade winds that normally blow from east to west across the tropical Pacific relax in response to El Niño’s warmer water conditions. The trade winds normally push warm water from east to west in the tropical Pacific and cause cold, nutrient-rich water upwelling in the eastern equatorial Pacific. Without the trade winds, warm water builds up in the central and eastern equatorial Pacific.

Anomalously warm water can cause the trade winds to weaken but weaker trade winds can cause ocean warming. It’s somewhat of a chicken-egg problem: “Do we see the ocean side of El Niño or the atmospheric side first?” But really it’s a chicken-egg coupled problem, because the atmosphere and the ocean are in contact and influence each other.

Once an El Niño gets established these atmospheric and oceanic effects can reinforce each other.

How does El Niño typically alter Earth’s weather patterns?

Shang-Ping Xie: In a typical El Niño year, India’s monsoon rainfall from June to September will decrease and may cause drought conditions. The second stop would be around Australia and Indonesia. They’re also likely to get dry conditions, and perhaps wildfires during North America’s fall months.

Then the third stop would be North America. El Niño often causes California and the southwestern states to experience more storms and increased rainfall in the winter months. That said, every El Niño is different and you can have a dry El Niño winter just like you can have a wet La Niña winter the way we just did.

The fourth stop – if the El Niño grows in magnitude – is the Pacific coast of South America during North American springtime. Countries like Peru can get heavy rainfall. The final stop would be China and Japan. In that part of the world, research shows that the last echo of a typical El Niño is heavy rains and flooding along the Yangtze River in China and across Japan.

At the global scale, the ocean warming that occurs during an El Niño year is enough to drive average global temperatures higher by heating the atmosphere around the equator. Layering El Niño on top of warming due to human-caused climate change could push global temperatures to new highs, including past the Paris Agreement threshold of 1.5 degrees Celsius [2.7 degrees Fahrenheit] of warming above pre-industrial levels.

California-El Niño-weather-waves-ocean

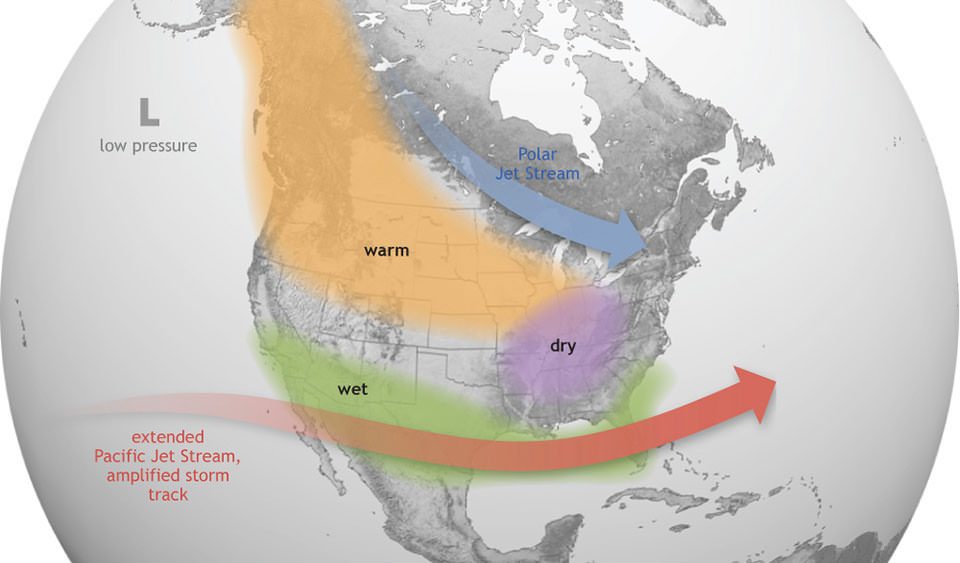
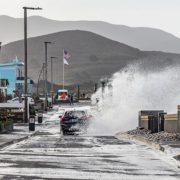
For California, especially Southern California, El Niño can typically mean larger storms in the winter which can mean more rainfall and larger waves along the coast. Graphic: NOAA

What can Californians expect from a typical El Niño year?

Dan Cayan (Climate Science Researcher): For California, the North Pacific storm track is often highly active during the winter months, and those storms can be shunted a bit farther southward, which can deliver a more direct hit to Southern California. So California, especially Southern California, can get larger storms in the winter which can mean more rainfall and larger waves along the coast. It can also be somewhat drier in the Pacific Northwest, with Northern California sort of being a fulcrum that can go either way.

Julie Kalansky (Climate scientist and deputy director for operations at the Center for Western Weather and Water Extremes): It’s important to stress that even though we see these general patterns during El Niño and La Niña years, there is still a lot of variability and not every event is going to follow the general pattern. Last year’s La Niña was a perfect example. We’d normally expect dry winter conditions from a La Niña in Southern California but it was wetter than normal. So, the declaration of an El Niño doesn’t guarantee that Southern California is going to have a wet, stormy winter, but it does stack the deck in that direction.

Laura Engeman (Coastal resilience specialist with the Center for Climate Change Impacts and Adaptation): Often during El Niño years California sees elevated sea levels. This is because El Ninos are associated with warmer sea surface waters in the equatorial eastern Pacific. When large swaths of the Pacific surface waters warm, there is a short-term thermal expansion of the ocean that raises sea levels along California’s coast. For example, in the 2015-2016 El Nino, California sea levels were elevated as much as 11 inches.

How does El Niño impact the California coast?

Adam Young (Integrative Oceanography Researcher): El Niño conditions can generate a triple threat for coastal hazards in California. Increased rainfall triggers landslides; powerful waves can accelerate erosion of beaches, sea cliffs, and bluffs, and cause coastal flooding; and strong El Niño conditions can raise sea level on the California coast by 15 to 30 centimeters (6-13 inches). Combined, these factors increase coastal erosion and flooding during El Niño events, which can threaten public parks, beaches, critical infrastructure, highways, and homes.

Some of what determines the severity of impacts is related to the timing of winter storms. For example, if large waves arrive during a very high tide, the potential for coastal flooding and other types of damage increases significantly. Multiple sequential storms can also be a factor. The first storm may strip all the sand off a beach, and without the natural sand buffer, the next storm can deliver a stronger punch. Every El Niño is different but these conditions increase the possibility for significant coastal impacts.

It’s important for us to monitor this year’s El Niño by mapping the coastline before and after the event so we can measure how the coast responds. The elevated sea levels associated with El Niño also provide a snapshot of how future sea level rise might impact our coast. Collecting these data is essential to improve our ability to predict hazards and plan for the future.

Can you blame individual weather events on El Niño?

Dan Cayan: It’s hard to directly attribute individual storms to a seasonal phenomenon. At the time scale of a season, if we get lots of storms and lots of precipitation I think it makes sense to at least partially attribute what happened with those storms to El Niño. But just like not all El Niño years follow the typical pattern, storms can also be atypical. So El Niño doesn’t dictate every storm but every storm is affected by El Niño. Individual weather patterns can be shifted or enhanced or reinforced by this seasonal phenomenon.

How do we detect El Niño?

Daniel Rudnick (Professor of Physical Oceanography): El Niños are detected using measurements from a combination of instruments including moored buoys, the Argo network of floats, and satellite measurements. Sea surface temperatures in the equatorial Pacific from those different sources are the measurements that NOAA uses to officially declare an El Niño.

Locally, I’ve been monitoring the effects of El Niño off California’s coast using underwater gliders since 2005. These autonomous gliders can cover about 15 miles underwater each day during a series of dives from the surface down to about 500 meters. This network of gliders gives us continuous measurements of temperature not just at the surface but at depth, as well as various other measurements related to oxygen concentration, salinity, and ocean currents. The glider data let us see how California’s waters are responding to changes caused by El Niño in real time. Taking all these measurements down to 500 meters helps screen out local factors that might only be altering conditions at the surface.

With the help of new funding from the Bipartisan Infrastructure Law and the Southern California Coastal Ocean Observing System, we are updating our fleet of gliders so they can go farther and carry more sensors. The new gliders will include sensors that detect nitrate, an important nutrient for phytoplankton, and pH, which will help us measure ocean acidification in local waters.

El Niño typically reduces the coastal upwelling that brings cold water full of nutrients like nitrate to the surface off California’s coast, and so having nitrate sensors on the gliders will help us to monitor the status of upwelling along the coast before, after, and during El Niño events.

El Niño

How does El Niño impact marine ecosystems?

Mark Ohman (Professor of Biological Oceanography): There are different effects for different organisms, but El Niño often reduces coastal upwelling in the eastern Pacific, which is an important source of nutrients for the plankton at the base of the food web. So, the broadest impact is that overall biological productivity in the eastern Pacific tends to decrease.

At the same time, the warmer waters off the coast of North America can also lead to an influx of subtropical and tropical species of plankton and fish. In San Diego, we sometimes see major influxes of swimming red crabs (Pleuroncodes planipes) that normally breed off the coast of Baja. When I first came to Scripps, a marine technician told me about a guano index for El Niño. If the guano stains from the seabirds on the Scripps pier turned from white to pink to red this indicated there was a strong El Niño, because the birds were feasting on the red crabs that had come north from Baja waters.

Seabirds and marine mammals may also alter the timing of their migrations if their major food sources diminish because of reduced upwelling. Blue whales, for instance, usually migrate into Southern California waters between May and September and presumably they might delay their arrival if reduced upwelling meant less krill were available.

Colleen Petrik (Assistant Professor of Biological Oceanography): Warmer waters in the eastern Pacific can allow for big open ocean fish like tuna to expand their range closer to the California coast. This range expansion also occurs vertically in the water column. Normally, deeper waters that are high in nutrients can be low in oxygen. But when upwelling is reduced by El Niño, oxygen levels in the middle depths can increase which allows species like tuna that need a lot of oxygen to move into those depths and find more food. Tuna often do quite well during El Niño years because they can expand their range horizontally into the eastern Pacific and vertically into these deeper waters that normally don’t have enough oxygen.

Ed Parnell (Associate Researcher in Integrative Oceanography Division): El Niño can be devastating for giant kelp forests in Southern California and Baja. Reduced coastal upwelling means fewer nutrients to fuel kelp growth and the altered storm track can mean more violent waves that rip out kelp.

Some recovery occurs during these colder water periods of La Nina conditions, but there hasn’t been a full recovery and now another El Niño is coming that will damage the system again. The whole system is being stressed more frequently and harder.

Kelp forests provide vital food and habitat for lots of marine species. Giant kelp grows fast but when it gets ripped out various understory algae species can move in that then make it even harder for the kelp forest to come back.

I’m very worried that with the ocean warming we are seeing and the increased likelihood of severe and frequent El Niños, that much of Southern California’s kelp canopy could disappear within my kids’ lifetime.

Jennifer Smith (Professor of Marine Biology): The impacts of El Niño depend on the specific event – its severity and duration – but an increase in ocean temperatures is ubiquitous, and that can make coral bleaching more likely. Corals are susceptible to changes in temperature and they will bleach if temperatures go above a certain threshold for too long.

The 2015-2016 El Niño is a clear example of how severe and how widespread the impact on coral reefs can be. During that event we saw massive bleaching in Hawaii, Australia’s Great Barrier Reef, the Caribbean, and places like Fiji in the South Pacific.

I was in the Hawaiian Islands in early August and there was no sign of bleaching, but the predictions suggest warming will continue or accelerate into winter. My lab is keeping a close eye on it and we are definitely worried about potential impacts.

We are hoping these ecosystems are adapting over time and can maybe show more resilience in the future because these heat waves are such a strong selective pressure for heat tolerant individuals. But we don’t know. My lab is actively researching this – looking for corals with more thermal tolerance and hopefully one day using that information to help reefs survive.

Is climate change altering the frequency or intensity of El Niño events?

Shang-Ping Xie: The short answer is we don’t know. It’s the subject of an ongoing and intense debate. Right now the models are telling us different things. This means our physical understanding isn’t yet precise enough to pin down how El Niño changes in a warmer climate. Really, it tells us we need more research into El Niño.

(Editor’s Note: Story by Alex Fox, at UC San Diego Scripps Institution of Oceanography, from UC San Diego Today. The San Diego County Water Authority has partnered with the Scripps Institution of Oceanography at UC San Diego to better predict atmospheric rivers and improve water management before, during, and after those seasonal storms.)

winter waves-Climate Change-Sea Level Rise-UCSD-Scripps Institution of Oceanography research

California’s Winter Waves May Be Increasing Under Climate Change

A new study from UC San Diego Scripps Institution of Oceanography researcher emeritus Peter Bromirski uses nearly a century of data to show that the average heights of winter waves along the California coast have increased as climate change has heated up the planet.

The study, published August 1 in the Journal of Geophysical Research – Oceans, achieved its extraordinarily long time series by using seismic records dating back to 1931 to infer wave height, a unique but accepted method first developed by Bromirski in 1999. The results, made more robust by their 90 years of statistical power, join a growing body of research that suggests storm activity in the North Pacific Ocean has increased under climate change.

If global warming accelerates, growing winter wave heights could have significant implications for flooding and erosion along California’s coast, which is already threatened by accelerating sea-level rise.

When waves reach shallow coastal waters, some of their energy is reflected back out to sea, Bromirski said. When this reflected wave energy collides with waves approaching the shoreline, their interaction creates a downward pressure signal that is converted into seismic energy at the seafloor. This seismic energy travels inland in the form of seismic waves that can be detected by seismographs. The strength of this seismic signal is directly related to wave height, which allowed him to calculate one from the other.

Calculating water heights

In using this relationship to infer wave height, Bromirski had to filter out the “noise” of actual earthquakes, which he said is easier than it sounds because earthquakes are typically much shorter in duration than the ocean waves caused by storms.

Bromirski developed this novel way to calculate wave heights out of necessity. Seeing patterns or trends in phenomena such as storm activity or big wave events associated with climate change requires many decades of data, and the buoys that directly measure wave heights along the California coast have only been collecting data since around 1980. Of particular interest to Bromirski were the decades prior to 1970 when global warming began a significant acceleration. If he could get his hands on wave records stretching back several decades before 1970, then he could assess the potential influence of climate change.

Since no direct wave measurements going back that far existed, Bromirski began a search for alternative sources of data in the 1990s. In 1999, he published a paper detailing his method of deriving historic wave heights using modern digital seismic records. In the process, Bromirski learned that UC Berkeley had seismic records going back nearly 70 years at the time. The problem was that these records were all analog — just sheets and sheets of paper covered in the jagged lines of seismograph readings.

To work in the many decades of seismic records held at UC Berkeley to create a long-term wave record using this method, Bromirski needed to digitize the reams of analog seismograms spanning 1931 to 1992 so that he could analyze the dataset as a whole. The process required the enthusiasm of multiple undergraduate students, a special flatbed scanner, and multiple years of intermittent effort to complete.

Finally, with the digitized seismic data spanning 1931-2021 in hand, Bromirski was able to transform those data into wave heights and begin to look for patterns.

Average winter wave height increased 13% since 1970

The analysis revealed that in the era beginning after 1970, California’s average winter wave height has increased by 13% or about 0.3 meters (one foot) compared to average winter wave height between 1931 and 1969. Bromirski also found that between 1996 and 2016 there were about twice as many storm events that produced waves greater than four meters (13 feet) in height along the California coast compared to the two decades spanning 1949 to 1969.

“After 1970, there is a consistently higher rate of large wave events,” said Bromirski. “It’s not uncommon to have a winter with high wave activity, but those winters occurred less frequently prior to 1970. Now, there are few winters with particularly low wave activity. And the fact that this change coincides with the acceleration of global warming near 1970 is consistent with increased storm activity over the North Pacific resulting from climate change.”

Bigger winter waves and sea-level rise

The results echo an increase in wave height in the North Atlantic tied to global warming reported by a 2000 study.

If California’s average winter waves continue to get bigger under climate change, it could amplify the effects of sea-level rise and have significant coastal impacts.

“Waves ride on top of the sea level, which is rising due to climate change,” said Bromirski. “When sea levels are elevated even further during storms, more wave energy can potentially reach vulnerable sea cliffs, flood low-lying regions, or damage coastal infrastructure.”

To see how his results compared with atmospheric patterns over the North Pacific, which typically supplies the California coast with its winter storms and waves, Bromirski looked to see if a semi-permanent wintertime low pressure system located near Alaska’s Aleutian Islands called the Aleutian Low had intensified in the modern era. A more pronounced Aleutian Low typically corresponds to increased storm activity and intensity.

Coastal impacts in California

Per the study, the intensity of the Aleutian Low has generally increased since 1970. “That intensification is a good confirmation that what we are seeing in the wave record derived from seismic data is consistent with increased storm activity,” said Bromirski. “If Pacific storms and the waves they produce keep intensifying as climate change progresses and sea-level rises, it creates a new dimension that needs to be considered in terms of trying to anticipate coastal impacts in California.”

(Editor’s Note: Story by Alex Fox, at UC San Diego Scripps Institution of Oceanography. The San Diego County Water Authority has partnered with the Scripps Institution of Oceanography at UC San Diego to better predict atmospheric rivers and improve water management before, during, and after those seasonal storms.)

FEMA Ranking Shows San Diego County Tops List of Most at Risk for Wildfires in Southern California

It’s that time of year when the dry heat, along with winds, increases the risk of wildfires.

The National Weather Service said the wildfire threat is elevated in our inland communities into next week.

CO2-Carbon Dioxide levels-Climate Change-Scripps Institution of Oceanography

Broken Record: Atmospheric Carbon Dioxide Levels Jump Again

Carbon dioxide levels measured at NOAA’s Mauna Loa Atmospheric Baseline Observatory peaked at 424 parts per million (ppm) in May, continuing a steady climb further into territory not seen for millions of years, scientists from NOAA and Scripps Institution of Oceanography at UC San Diego announced today.

Measurements of carbon dioxide (CO2) obtained by NOAA’s Global Monitoring Laboratory averaged 424 parts per million in May, the month when CO2 peaks in the Northern Hemisphere. That represents an increase of 3.0 ppm over May 2022. Scientists at Scripps Oceanography, which maintains an independent record, calculated a May monthly average of 423.78 ppm. That increase is also a jump of 3.0 ppm over the May 2022 average reported by the Scripps COProgram.

“Sadly we’re setting a new record,” said Scripps Oceanography geoscientist Ralph Keeling, who oversees the iconic Keeling Curve record established by his father 65 years ago. “What we’d like to see is the curve plateauing and even falling because carbon dioxide as high as 420 or 425 parts per million is not good. It shows as much as we’ve done to mitigate and reduce emissions, we still have a long way to go.”

Carbon dioxide levels

CO2 levels are now more than 50% higher than they were before the onset of the industrial era.

“Every year we see carbon dioxide levels in our atmosphere increase as a direct result of human activity,” said NOAA Administrator Rick Spinrad, Ph.D. “Every year, we see the impacts of climate change in the heat waves, droughts, flooding, wildfires and storms happening all around us. While we will have to adapt to the climate impacts we cannot avoid, we must expend every effort to slash carbon pollution and safeguard this planet and the life that calls it home.”

CO2 pollution is generated by burning fossil fuels for transportation and electrical generation, by cement manufacturing, deforestation, agriculture and many other practices. Like other greenhouse gases, COtraps heat radiating from the planet’s surface that would otherwise escape into space, amplifying extreme weather events, such as heat waves, drought and wildfires, as well as precipitation and flooding.

Rising CO2 levels also pose a threat to the world’s ocean, which absorbs both CO2 gas and excess heat from the atmosphere. Impacts include increasing surface and subsurface ocean temperatures and the disruption of marine ecosystems, rising sea levels and ocean acidification, which changes the chemistry of seawater, leading to lower dissolved oxygen, and interferes with the growth of some marine organisms.

This year, NOAA’s measurements were obtained from a temporary sampling site atop the nearby Mauna Kea volcano, which was established after lava flows cut off access to the Mauna Loa observatory in November 2022. Scripps’s May measurements were taken at Mauna Loa, after NOAA staff successfully repowered a Scripps instrument with a solar and battery system in March.

Climate Change

The Mauna Loa data, together with measurements from sampling stations around the world, are incorporated by NOAA’s Global Monitoring Laboratory into the Global Greenhouse Gas Reference Network, a foundational research dataset for international climate scientists and a benchmark for policymakers attempting to address the causes and impacts of climate change.

Widely considered the premier global sampling location for monitoring atmospheric CO2, NOAA and Scripps observatory operations were abruptly suspended on Nov. 29, 2022 when lava flows from the eruption of Mauna Loa volcano buried more than a mile of access road and destroyed transmission lines delivering power to the observatory campus. After a 10-day interruption, NOAA restarted greenhouse gas observations on Dec. 8 from a temporary instrument installation on the deck of the University of Hawaii observatory, located near the summit of Mauna Kea volcano. Scripps Oceanography initiated air sampling at Mauna Kea on Dec. 14, 2022 and resumed sampling at Mauna Loa on March 9, while maintaining their Mauna Kea observations.

Mauna Loa and Mauna Kea

Continuous daily samples were obtained from both Mauna Loa and Mauna Kea by Scripps Oceanography during May, the month when CO2 levels in the Northern Hemisphere reach their maximum levels for the year. Scripps recorded a May CO2  reading from Maunakea of 423.83, which is very close to the reading of 423.78 from Mauna Loa.

The Mauna Loa observatory is situated at an elevation of 11,141 feet above sea level, while the Mauna Kea sampling location is slightly higher, at an elevation of 13,600 feet. Scientists are able to sample air undisturbed by the influence of local pollution or vegetation, and produce measurements that represent the average state of the atmosphere in the Northern Hemisphere from both locations.

Scripps Oceanography geoscientist Charles David Keeling initiated on-site measurements of CO2 at NOAA’s Mauna Loa weather station in 1958. Keeling was the first to recognize that CO2 levels in the Northern Hemisphere fell during the growing season, and rose as plants died back in the fall. He documented these CO2 fluctuations in a record that came to be known as the Keeling Curve. He was also the first to recognize that, despite the seasonal fluctuation, CO2 levels rose every year.

NOAA began measurements in 1974, and the two research institutions have made complementary, independent observations ever since.

(Editor’s Note: The San Diego County Water Authority has partnered with the Scripps Institution of Oceanography at UC San Diego to better predict atmospheric rivers and improve water management before, during, and after those seasonal storms.) 

California snowlines-Scripps Institution of Oceanography-study-Climate Change

California Snowlines On Track To Be 1,600 Feet Higher by Century’s End

This winter produced record snowfall in California, but a new study suggests the state should expect gradually declining snowpacks, even if punctuated with occasional epic snowfalls, in the future.

An analysis by Tamara Shulgina, Alexander Gershunov, and other climate scientists at UC San Diego’s Scripps Institution of Oceanography suggest that in the face of unabated global warming, the snowlines marking where rainfall turns to snow have been rising significantly over the past 70 years. Projections by the researchers suggest the trend will continue with snowlines rising hundreds of meters higher by the second half of this century.

California snowlines and lower-elevation ski resorts

In the high Southern Sierra Nevada range, for instance, snowlines are projected to rise by more than 500 meters (1,600 feet) and even more when the mountains get precipitation from atmospheric rivers, jets of water vapor that are becoming an increasingly potent source of the state’s water supply.

“In an average year, the snowpack will be increasingly confined to the peak of winter and to the highest elevations,” the study says.

Diminished snowfall is a consequence of a changing climate in which places like California will get an increasing portion of their winter precipitation as rain instead of snow. The authors said this study and related research suggest water resource managers will need to adapt to a feast-or-famine future. California’s water supply will arrive less through the gradual melt of mountain snowpack that gets the state through hot summers and more via bursts of rain and runoff delivered by atmospheric rivers, which are boosted by warming and are associated with higher snowlines than other storms.

Warmer summers

Such events will further complicate the balancing act between protecting people and infrastructure from winter flooding and ensuring enough water supply during warmer summers.

“This work adds insight into the climate change narrative of more rain and less snow,” said California Department of Water Resources Climatologist Mike Anderson. “DWR appreciates our partnership with Scripps to help water managers develop, refine, and implement adaptation efforts as the world continues to warm and climate change impacts are realized.”

The study, funded by the U.S. Bureau of Reclamation and the DWR, appears in the journal Climate Dynamics today.

“This is the longest and most detailed account of snow accumulation in California,” said Gershunov, “resolving individual storms over 70 years of observed weather combined with projections out to 2100.”

Climate change impacts to ski industry

The authors make note of what this could mean for ski resorts around the state if climate change progresses unabated. For example, Mammoth Mountain, at an elevation between 2,400 and 3,300 meters (7,900 – 11,000 feet), is projected to receive 28 percent less snowfall in the latter half of the century. Lower elevation ski resorts such as Palisades and Northstar, both near Lake Tahoe, span elevational ranges of around 1,900 and 2,700 meters (6,200 – 8,900 feet). They are projected to lose more than 70 percent of their snow accumulation in an average winter.

“Snowlines will keep lifting”

“Observations and future climate projections show that already rising snowlines will keep lifting,” said Gershunov. “Epic winters will still be possible, though, and unprecedented snowfalls will ironically become more likely due to wetter atmospheric rivers, but they will be increasingly confined to the peak of winter and to the highest elevations of the Southern Sierra Nevada.”

Study co-authors include Kristen Guirguis, Daniel Cayan, David Pierce, Michael Dettinger, and F. Martin Ralph of Scripps Oceanography, Benjamin Hatchett of the Desert Research Institute of Reno, Nev., Aneesh Subramanian of University of Colorado at Boulder, Steven Margulis and Yiwen Fang of UCLA, and Michael L. Anderson of the California Department of Water Resources.

(Editor’s Note: Story by Robert Monroe, at UC San Diego Scripps Institution of Oceanography. The San Diego County Water Authority has partnered with the Scripps Institution of Oceanography at UC San Diego to better predict atmospheric rivers and improve water management before, during, and after those seasonal storms.)

Will Clouds Shield Us From Climate Change? San Diego Could Hold Key Answers.

Researchers at UC San Diego have launched a year-long project aimed at better understanding the region’s clouds and, by extension, global warming.

A bevy of equipment provided by the U.S. Department of Energy was recently deployed on Mount Soledad and at the university’s Ellen Browning Scripps Memorial Pier.

Scripps Climate Program Renewed With New Focus on Adaptation

With $5 million in funding from NOAA’s Climate Adaptation Partners (CAP) initiative, the California Nevada Adaptation Program (CNAP), a collaborative initiative between UC San Diego’s Scripps Institution of Oceanography and the DRI in Reno, Nevada will work to expand climate research and focus on building adaptation strategies. The program will last five years and aim to empower local communities to use this knowledge to make informed decisions in the face of long-term drought, unprecedented wildfires, and extreme heat impacting public health.

Atmospheric River Reconnaissance Flight Season Gets an Early Start This Winter

An expanded Atmospheric River Reconnaissance program began last month as a result of the unexpected “bomb cyclone” in October 2021 that hit North America’s West Coast, followed by another atmospheric river less than a month later that caused severe flooding in Washington.

“Climatologically, November and December can bring some of the worst floods for that part of the world,” said research meteorologist Marty Ralph, director of the Center for Western Weather and Water Extremes (CW3E) at UC San Diego’s Scripps Institution of Oceanography. Ralph leads the AR Recon program, along with Vijay Tallapragada, Ph.D., Senior Scientist at NOAA’s Environmental Modeling Center, in partnership with the U.S. Army Corps of Engineers, the California Dept. of Water Resources, NOAA Office of Marine and Aviation Operations, and the U.S. Air Force Reserve 53rd Weather Reconnaissance Squadron “Hurricane Hunters.”

More Evidence that California Weather is Trending Toward Extremes

A team led by Kristen Guirguis, a climate researcher at Scripps Institution of Oceanography at UC San Diego, found evidence that the risk of hazardous weather is increasing in the Southwest.

The researchers investigated the daily relationships among four major modes of weather affecting California. How they interact governs the formation of weather events such as atmospheric rivers capable of bringing torrential rains and Santa Ana winds that can spread devastating wildfires.

“This study suggests that weather patterns are changing in a way that enhances hot, dry Santa Ana winds, while reducing precipitation frequency in the Southwest,” said Guirguis. “These changes in atmospheric circulation are raising the risk of wildfires during California winters.”

Few Strong Landfalling Atmospheric Rivers Reach California

Few landfalling atmospheric rivers in the current water year have reached California, now in the third year of a statewide drought.

The latest update from the Center for Western Weather and Water Extremes, Scripps Institution of Oceanography at UC San Diego, shows that Water Year 2022 started strong in October, but weaker storms did not ease dry conditions.