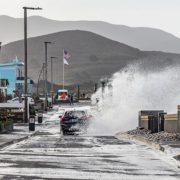
A new study from UC San Diego Scripps Institution of Oceanography researcher emeritus Peter Bromirski uses nearly a century of data to show that the average heights of winter waves along the California coast have increased as climate change has heated up the planet.
The study, published August 1 in the Journal of Geophysical Research – Oceans, achieved its extraordinarily long time series by using seismic records dating back to 1931 to infer wave height, a unique but accepted method first developed by Bromirski in 1999. The results, made more robust by their 90 years of statistical power, join a growing body of research that suggests storm activity in the North Pacific Ocean has increased under climate change.
If global warming accelerates, growing winter wave heights could have significant implications for flooding and erosion along California’s coast, which is already threatened by accelerating sea-level rise.
When waves reach shallow coastal waters, some of their energy is reflected back out to sea, Bromirski said. When this reflected wave energy collides with waves approaching the shoreline, their interaction creates a downward pressure signal that is converted into seismic energy at the seafloor. This seismic energy travels inland in the form of seismic waves that can be detected by seismographs. The strength of this seismic signal is directly related to wave height, which allowed him to calculate one from the other.
Calculating water heights
In using this relationship to infer wave height, Bromirski had to filter out the “noise” of actual earthquakes, which he said is easier than it sounds because earthquakes are typically much shorter in duration than the ocean waves caused by storms.
Bromirski developed this novel way to calculate wave heights out of necessity. Seeing patterns or trends in phenomena such as storm activity or big wave events associated with climate change requires many decades of data, and the buoys that directly measure wave heights along the California coast have only been collecting data since around 1980. Of particular interest to Bromirski were the decades prior to 1970 when global warming began a significant acceleration. If he could get his hands on wave records stretching back several decades before 1970, then he could assess the potential influence of climate change.
Since no direct wave measurements going back that far existed, Bromirski began a search for alternative sources of data in the 1990s. In 1999, he published a paper detailing his method of deriving historic wave heights using modern digital seismic records. In the process, Bromirski learned that UC Berkeley had seismic records going back nearly 70 years at the time. The problem was that these records were all analog — just sheets and sheets of paper covered in the jagged lines of seismograph readings.
To work in the many decades of seismic records held at UC Berkeley to create a long-term wave record using this method, Bromirski needed to digitize the reams of analog seismograms spanning 1931 to 1992 so that he could analyze the dataset as a whole. The process required the enthusiasm of multiple undergraduate students, a special flatbed scanner, and multiple years of intermittent effort to complete.
Finally, with the digitized seismic data spanning 1931-2021 in hand, Bromirski was able to transform those data into wave heights and begin to look for patterns.
Average winter wave height increased 13% since 1970
The analysis revealed that in the era beginning after 1970, California’s average winter wave height has increased by 13% or about 0.3 meters (one foot) compared to average winter wave height between 1931 and 1969. Bromirski also found that between 1996 and 2016 there were about twice as many storm events that produced waves greater than four meters (13 feet) in height along the California coast compared to the two decades spanning 1949 to 1969.
“After 1970, there is a consistently higher rate of large wave events,” said Bromirski. “It’s not uncommon to have a winter with high wave activity, but those winters occurred less frequently prior to 1970. Now, there are few winters with particularly low wave activity. And the fact that this change coincides with the acceleration of global warming near 1970 is consistent with increased storm activity over the North Pacific resulting from climate change.”
Bigger winter waves and sea-level rise
The results echo an increase in wave height in the North Atlantic tied to global warming reported by a 2000 study.
If California’s average winter waves continue to get bigger under climate change, it could amplify the effects of sea-level rise and have significant coastal impacts.
“Waves ride on top of the sea level, which is rising due to climate change,” said Bromirski. “When sea levels are elevated even further during storms, more wave energy can potentially reach vulnerable sea cliffs, flood low-lying regions, or damage coastal infrastructure.”
To see how his results compared with atmospheric patterns over the North Pacific, which typically supplies the California coast with its winter storms and waves, Bromirski looked to see if a semi-permanent wintertime low pressure system located near Alaska’s Aleutian Islands called the Aleutian Low had intensified in the modern era. A more pronounced Aleutian Low typically corresponds to increased storm activity and intensity.
Coastal impacts in California
Per the study, the intensity of the Aleutian Low has generally increased since 1970. “That intensification is a good confirmation that what we are seeing in the wave record derived from seismic data is consistent with increased storm activity,” said Bromirski. “If Pacific storms and the waves they produce keep intensifying as climate change progresses and sea-level rises, it creates a new dimension that needs to be considered in terms of trying to anticipate coastal impacts in California.”
(Editor’s Note: Story by Alex Fox, at UC San Diego Scripps Institution of Oceanography. The San Diego County Water Authority has partnered with the Scripps Institution of Oceanography at UC San Diego to better predict atmospheric rivers and improve water management before, during, and after those seasonal storms.)


