Posts

winter waves-Climate Change-Sea Level Rise-UCSD-Scripps Institution of Oceanography research

California’s Winter Waves May Be Increasing Under Climate Change

A new study from UC San Diego Scripps Institution of Oceanography researcher emeritus Peter Bromirski uses nearly a century of data to show that the average heights of winter waves along the California coast have increased as climate change has heated up the planet.

The study, published August 1 in the Journal of Geophysical Research – Oceans, achieved its extraordinarily long time series by using seismic records dating back to 1931 to infer wave height, a unique but accepted method first developed by Bromirski in 1999. The results, made more robust by their 90 years of statistical power, join a growing body of research that suggests storm activity in the North Pacific Ocean has increased under climate change.

If global warming accelerates, growing winter wave heights could have significant implications for flooding and erosion along California’s coast, which is already threatened by accelerating sea-level rise.

When waves reach shallow coastal waters, some of their energy is reflected back out to sea, Bromirski said. When this reflected wave energy collides with waves approaching the shoreline, their interaction creates a downward pressure signal that is converted into seismic energy at the seafloor. This seismic energy travels inland in the form of seismic waves that can be detected by seismographs. The strength of this seismic signal is directly related to wave height, which allowed him to calculate one from the other.

Calculating water heights

In using this relationship to infer wave height, Bromirski had to filter out the “noise” of actual earthquakes, which he said is easier than it sounds because earthquakes are typically much shorter in duration than the ocean waves caused by storms.

Bromirski developed this novel way to calculate wave heights out of necessity. Seeing patterns or trends in phenomena such as storm activity or big wave events associated with climate change requires many decades of data, and the buoys that directly measure wave heights along the California coast have only been collecting data since around 1980. Of particular interest to Bromirski were the decades prior to 1970 when global warming began a significant acceleration. If he could get his hands on wave records stretching back several decades before 1970, then he could assess the potential influence of climate change.

Since no direct wave measurements going back that far existed, Bromirski began a search for alternative sources of data in the 1990s. In 1999, he published a paper detailing his method of deriving historic wave heights using modern digital seismic records. In the process, Bromirski learned that UC Berkeley had seismic records going back nearly 70 years at the time. The problem was that these records were all analog — just sheets and sheets of paper covered in the jagged lines of seismograph readings.

To work in the many decades of seismic records held at UC Berkeley to create a long-term wave record using this method, Bromirski needed to digitize the reams of analog seismograms spanning 1931 to 1992 so that he could analyze the dataset as a whole. The process required the enthusiasm of multiple undergraduate students, a special flatbed scanner, and multiple years of intermittent effort to complete.

Finally, with the digitized seismic data spanning 1931-2021 in hand, Bromirski was able to transform those data into wave heights and begin to look for patterns.

Average winter wave height increased 13% since 1970

The analysis revealed that in the era beginning after 1970, California’s average winter wave height has increased by 13% or about 0.3 meters (one foot) compared to average winter wave height between 1931 and 1969. Bromirski also found that between 1996 and 2016 there were about twice as many storm events that produced waves greater than four meters (13 feet) in height along the California coast compared to the two decades spanning 1949 to 1969.

“After 1970, there is a consistently higher rate of large wave events,” said Bromirski. “It’s not uncommon to have a winter with high wave activity, but those winters occurred less frequently prior to 1970. Now, there are few winters with particularly low wave activity. And the fact that this change coincides with the acceleration of global warming near 1970 is consistent with increased storm activity over the North Pacific resulting from climate change.”

Bigger winter waves and sea-level rise

The results echo an increase in wave height in the North Atlantic tied to global warming reported by a 2000 study.

If California’s average winter waves continue to get bigger under climate change, it could amplify the effects of sea-level rise and have significant coastal impacts.

“Waves ride on top of the sea level, which is rising due to climate change,” said Bromirski. “When sea levels are elevated even further during storms, more wave energy can potentially reach vulnerable sea cliffs, flood low-lying regions, or damage coastal infrastructure.”

To see how his results compared with atmospheric patterns over the North Pacific, which typically supplies the California coast with its winter storms and waves, Bromirski looked to see if a semi-permanent wintertime low pressure system located near Alaska’s Aleutian Islands called the Aleutian Low had intensified in the modern era. A more pronounced Aleutian Low typically corresponds to increased storm activity and intensity.

Coastal impacts in California

Per the study, the intensity of the Aleutian Low has generally increased since 1970. “That intensification is a good confirmation that what we are seeing in the wave record derived from seismic data is consistent with increased storm activity,” said Bromirski. “If Pacific storms and the waves they produce keep intensifying as climate change progresses and sea-level rises, it creates a new dimension that needs to be considered in terms of trying to anticipate coastal impacts in California.”

(Editor’s Note: Story by Alex Fox, at UC San Diego Scripps Institution of Oceanography. The San Diego County Water Authority has partnered with the Scripps Institution of Oceanography at UC San Diego to better predict atmospheric rivers and improve water management before, during, and after those seasonal storms.)

As Salton Sea Shrinks, Potential for Earthquakes Reduced, New Study Finds

The shrinking and drying out of the Salton Sea has reduced stress on the San Andreas Fault, possibly reducing the frequency and severity of earthquakes in Southern California, according to research from San Diego State University and Scripps Institution of Oceanography.

The study, published Wednesday in the journal Nature, found that the reduced stress on the fault from a significantly lesser amount of water may be delaying the next “big one.”

Broken Record: Atmospheric Carbon Dioxide Levels Jump Again

Carbon dioxide levels measured at NOAA’s Mauna Loa Atmospheric Baseline Observatory peaked at 424 parts per million (ppm) in May, continuing a steady climb further into territory not seen for millions of years, scientists from NOAA and Scripps Institution of Oceanography at UC San Diego announced today, June 5, 2023.

CO2-Carbon Dioxide levels-Climate Change-Scripps Institution of Oceanography

Broken Record: Atmospheric Carbon Dioxide Levels Jump Again

Carbon dioxide levels measured at NOAA’s Mauna Loa Atmospheric Baseline Observatory peaked at 424 parts per million (ppm) in May, continuing a steady climb further into territory not seen for millions of years, scientists from NOAA and Scripps Institution of Oceanography at UC San Diego announced today.

Measurements of carbon dioxide (CO2) obtained by NOAA’s Global Monitoring Laboratory averaged 424 parts per million in May, the month when CO2 peaks in the Northern Hemisphere. That represents an increase of 3.0 ppm over May 2022. Scientists at Scripps Oceanography, which maintains an independent record, calculated a May monthly average of 423.78 ppm. That increase is also a jump of 3.0 ppm over the May 2022 average reported by the Scripps COProgram.

“Sadly we’re setting a new record,” said Scripps Oceanography geoscientist Ralph Keeling, who oversees the iconic Keeling Curve record established by his father 65 years ago. “What we’d like to see is the curve plateauing and even falling because carbon dioxide as high as 420 or 425 parts per million is not good. It shows as much as we’ve done to mitigate and reduce emissions, we still have a long way to go.”

Carbon dioxide levels

CO2 levels are now more than 50% higher than they were before the onset of the industrial era.

“Every year we see carbon dioxide levels in our atmosphere increase as a direct result of human activity,” said NOAA Administrator Rick Spinrad, Ph.D. “Every year, we see the impacts of climate change in the heat waves, droughts, flooding, wildfires and storms happening all around us. While we will have to adapt to the climate impacts we cannot avoid, we must expend every effort to slash carbon pollution and safeguard this planet and the life that calls it home.”

CO2 pollution is generated by burning fossil fuels for transportation and electrical generation, by cement manufacturing, deforestation, agriculture and many other practices. Like other greenhouse gases, COtraps heat radiating from the planet’s surface that would otherwise escape into space, amplifying extreme weather events, such as heat waves, drought and wildfires, as well as precipitation and flooding.

Rising CO2 levels also pose a threat to the world’s ocean, which absorbs both CO2 gas and excess heat from the atmosphere. Impacts include increasing surface and subsurface ocean temperatures and the disruption of marine ecosystems, rising sea levels and ocean acidification, which changes the chemistry of seawater, leading to lower dissolved oxygen, and interferes with the growth of some marine organisms.

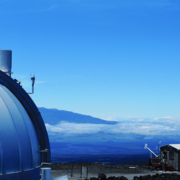
This year, NOAA’s measurements were obtained from a temporary sampling site atop the nearby Mauna Kea volcano, which was established after lava flows cut off access to the Mauna Loa observatory in November 2022. Scripps’s May measurements were taken at Mauna Loa, after NOAA staff successfully repowered a Scripps instrument with a solar and battery system in March.

Climate Change

The Mauna Loa data, together with measurements from sampling stations around the world, are incorporated by NOAA’s Global Monitoring Laboratory into the Global Greenhouse Gas Reference Network, a foundational research dataset for international climate scientists and a benchmark for policymakers attempting to address the causes and impacts of climate change.

Widely considered the premier global sampling location for monitoring atmospheric CO2, NOAA and Scripps observatory operations were abruptly suspended on Nov. 29, 2022 when lava flows from the eruption of Mauna Loa volcano buried more than a mile of access road and destroyed transmission lines delivering power to the observatory campus. After a 10-day interruption, NOAA restarted greenhouse gas observations on Dec. 8 from a temporary instrument installation on the deck of the University of Hawaii observatory, located near the summit of Mauna Kea volcano. Scripps Oceanography initiated air sampling at Mauna Kea on Dec. 14, 2022 and resumed sampling at Mauna Loa on March 9, while maintaining their Mauna Kea observations.

Mauna Loa and Mauna Kea

Continuous daily samples were obtained from both Mauna Loa and Mauna Kea by Scripps Oceanography during May, the month when CO2 levels in the Northern Hemisphere reach their maximum levels for the year. Scripps recorded a May CO2  reading from Maunakea of 423.83, which is very close to the reading of 423.78 from Mauna Loa.

The Mauna Loa observatory is situated at an elevation of 11,141 feet above sea level, while the Mauna Kea sampling location is slightly higher, at an elevation of 13,600 feet. Scientists are able to sample air undisturbed by the influence of local pollution or vegetation, and produce measurements that represent the average state of the atmosphere in the Northern Hemisphere from both locations.

Scripps Oceanography geoscientist Charles David Keeling initiated on-site measurements of CO2 at NOAA’s Mauna Loa weather station in 1958. Keeling was the first to recognize that CO2 levels in the Northern Hemisphere fell during the growing season, and rose as plants died back in the fall. He documented these CO2 fluctuations in a record that came to be known as the Keeling Curve. He was also the first to recognize that, despite the seasonal fluctuation, CO2 levels rose every year.

NOAA began measurements in 1974, and the two research institutions have made complementary, independent observations ever since.

(Editor’s Note: The San Diego County Water Authority has partnered with the Scripps Institution of Oceanography at UC San Diego to better predict atmospheric rivers and improve water management before, during, and after those seasonal storms.) 

California snowlines-Scripps Institution of Oceanography-study-Climate Change

California Snowlines On Track To Be 1,600 Feet Higher by Century’s End

This winter produced record snowfall in California, but a new study suggests the state should expect gradually declining snowpacks, even if punctuated with occasional epic snowfalls, in the future.

An analysis by Tamara Shulgina, Alexander Gershunov, and other climate scientists at UC San Diego’s Scripps Institution of Oceanography suggest that in the face of unabated global warming, the snowlines marking where rainfall turns to snow have been rising significantly over the past 70 years. Projections by the researchers suggest the trend will continue with snowlines rising hundreds of meters higher by the second half of this century.

California snowlines and lower-elevation ski resorts

In the high Southern Sierra Nevada range, for instance, snowlines are projected to rise by more than 500 meters (1,600 feet) and even more when the mountains get precipitation from atmospheric rivers, jets of water vapor that are becoming an increasingly potent source of the state’s water supply.

“In an average year, the snowpack will be increasingly confined to the peak of winter and to the highest elevations,” the study says.

Diminished snowfall is a consequence of a changing climate in which places like California will get an increasing portion of their winter precipitation as rain instead of snow. The authors said this study and related research suggest water resource managers will need to adapt to a feast-or-famine future. California’s water supply will arrive less through the gradual melt of mountain snowpack that gets the state through hot summers and more via bursts of rain and runoff delivered by atmospheric rivers, which are boosted by warming and are associated with higher snowlines than other storms.

Warmer summers

Such events will further complicate the balancing act between protecting people and infrastructure from winter flooding and ensuring enough water supply during warmer summers.

“This work adds insight into the climate change narrative of more rain and less snow,” said California Department of Water Resources Climatologist Mike Anderson. “DWR appreciates our partnership with Scripps to help water managers develop, refine, and implement adaptation efforts as the world continues to warm and climate change impacts are realized.”

The study, funded by the U.S. Bureau of Reclamation and the DWR, appears in the journal Climate Dynamics today.

“This is the longest and most detailed account of snow accumulation in California,” said Gershunov, “resolving individual storms over 70 years of observed weather combined with projections out to 2100.”

Climate change impacts to ski industry

The authors make note of what this could mean for ski resorts around the state if climate change progresses unabated. For example, Mammoth Mountain, at an elevation between 2,400 and 3,300 meters (7,900 – 11,000 feet), is projected to receive 28 percent less snowfall in the latter half of the century. Lower elevation ski resorts such as Palisades and Northstar, both near Lake Tahoe, span elevational ranges of around 1,900 and 2,700 meters (6,200 – 8,900 feet). They are projected to lose more than 70 percent of their snow accumulation in an average winter.

“Snowlines will keep lifting”

“Observations and future climate projections show that already rising snowlines will keep lifting,” said Gershunov. “Epic winters will still be possible, though, and unprecedented snowfalls will ironically become more likely due to wetter atmospheric rivers, but they will be increasingly confined to the peak of winter and to the highest elevations of the Southern Sierra Nevada.”

Study co-authors include Kristen Guirguis, Daniel Cayan, David Pierce, Michael Dettinger, and F. Martin Ralph of Scripps Oceanography, Benjamin Hatchett of the Desert Research Institute of Reno, Nev., Aneesh Subramanian of University of Colorado at Boulder, Steven Margulis and Yiwen Fang of UCLA, and Michael L. Anderson of the California Department of Water Resources.

(Editor’s Note: Story by Robert Monroe, at UC San Diego Scripps Institution of Oceanography. The San Diego County Water Authority has partnered with the Scripps Institution of Oceanography at UC San Diego to better predict atmospheric rivers and improve water management before, during, and after those seasonal storms.)

Coldest Ocean Water Temperature in Decades Recorded Off San Diego County

The ocean temperature off Del Mar fell to 52.25 degrees this week, the lowest reading in San Diego County waters since UC San Diego began using a buoy system in the 1970s to monitor large areas of the U.S. coastline.

UCSD’s Scripps Institution of Oceanography said near-record low readings also were recorded this week at many other stations, including off Imperial Beach and Leucadia, where the temperature was 53.5 degrees on Wednesday.

Opinion: We Should Use Technology to Improve California’s Ability to Manage Floods, Water Supplies

Torrential rains are periodically pounding California this winter and putting a dent in the most extreme drought conditions of the past 1,200 years. While that’s a relief for some 40 million residents, it’s also a reminder of the feast-or-famine climate that rules California and creates major challenges for water managers.

Atmospheric River Reconnaissance Flight Season Gets an Early Start This Winter

An expanded Atmospheric River Reconnaissance program began last month as a result of the unexpected “bomb cyclone” in October 2021 that hit North America’s West Coast, followed by another atmospheric river less than a month later that caused severe flooding in Washington.

“Climatologically, November and December can bring some of the worst floods for that part of the world,” said research meteorologist Marty Ralph, director of the Center for Western Weather and Water Extremes (CW3E) at UC San Diego’s Scripps Institution of Oceanography. Ralph leads the AR Recon program, along with Vijay Tallapragada, Ph.D., Senior Scientist at NOAA’s Environmental Modeling Center, in partnership with the U.S. Army Corps of Engineers, the California Dept. of Water Resources, NOAA Office of Marine and Aviation Operations, and the U.S. Air Force Reserve 53rd Weather Reconnaissance Squadron “Hurricane Hunters.”

Why Our Drought Isn’t Going Anywhere This Winter

The latest measurements from the National Oceanic and Atmospheric Administration shows the American West is in for another dry La Niña winter, unwelcome news for the West currently struggling to keep flowing its main source of water: the shrinking Colorado River.

“That’s the worry in the present situation is that the odds now are now with La Niña are tilted against a really wet winter, at least in the southern half of California which of course has already been really dry,” said Dan Cayan, a research meteorologist at the Scripps Institution of Oceanography.

Climate Change Projected to Increase Atmospheric River Flood Damages in the United States

A research team at Scripps Institution of Oceanography at UC San Diego has found that flood damages triggered by atmospheric river storms may triple from $1 billion a year to over $3 billion a year by the end of the century unless action is taken to reduce global greenhouse gas emissions.