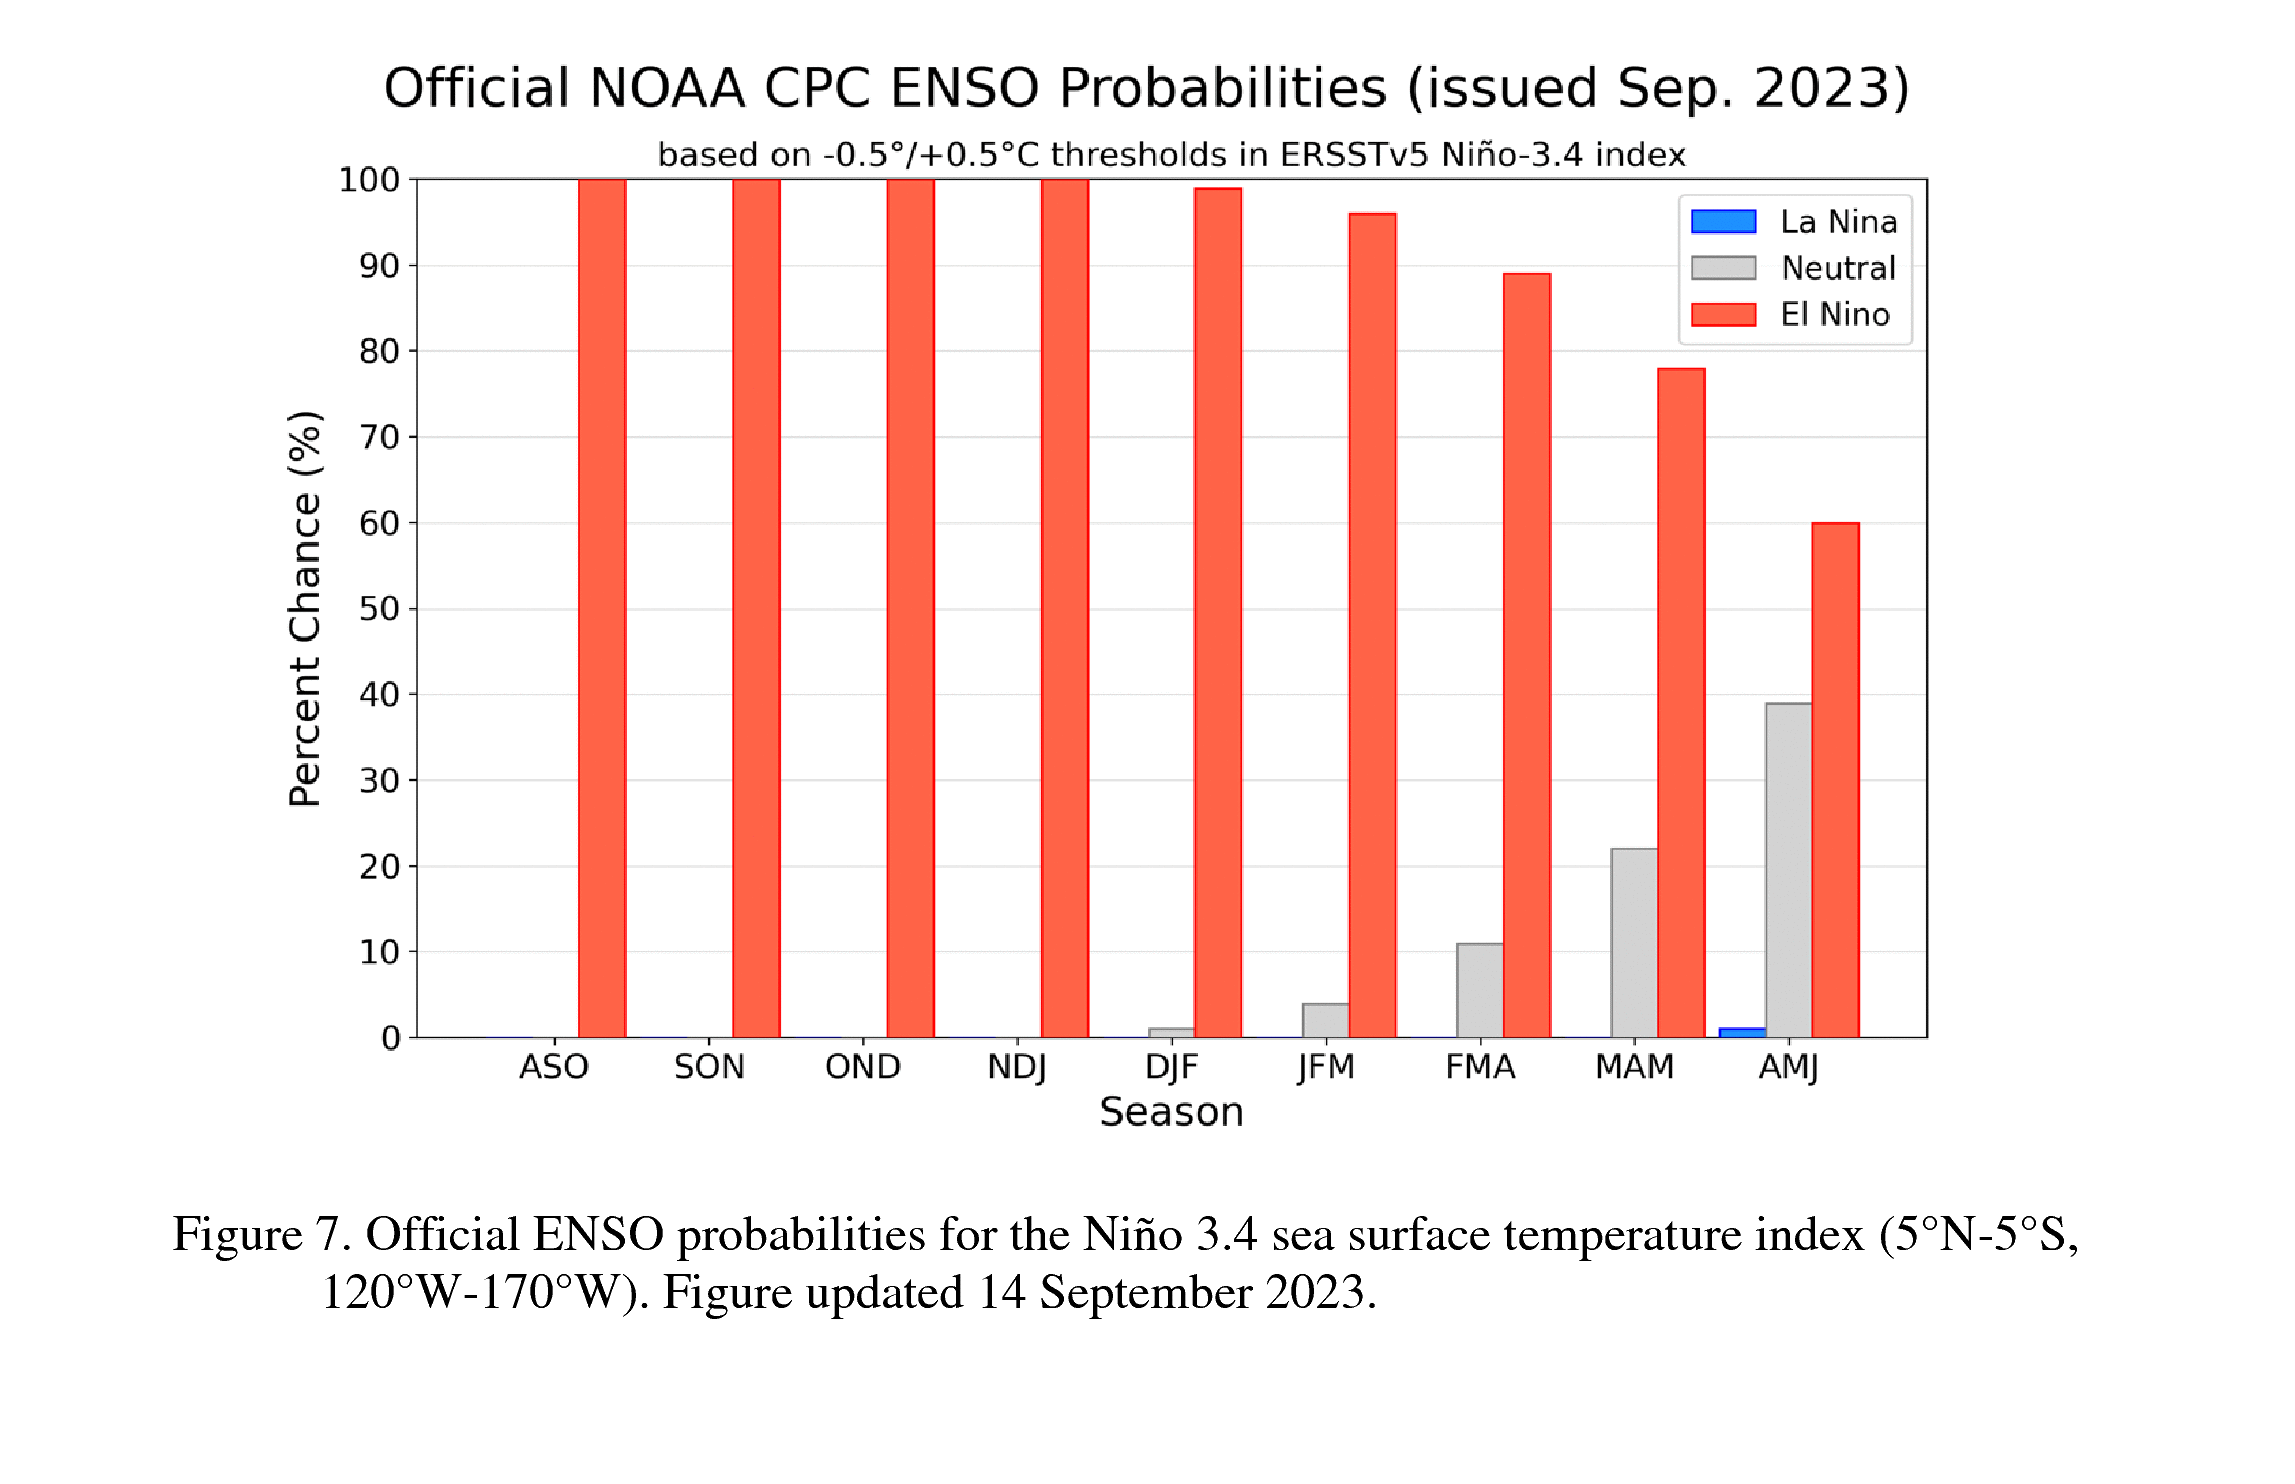
El Niño is anticipated to continue through the Northern Hemisphere winter (with a greater than 95% chance through January – March 2024). An El Niño Advisory remains in effect.
In August, sea surface temperatures (SSTs) were above average across the equatorial Pacific Ocean [Fig. 1], with strengthening in the central and east-central Pacific. All of the latest weekly Niño indices were in excess of +1.0°C: Niño-4 was +1.1°C, Niño-3.4 was +1.6°C, Niño-3 was +2.2°C, and Niño1+2 was +2.9°C [Fig. 2]. Area-averaged subsurface temperatures anomalies increased compared to July [Fig. 3] in association with anomalous warmth in the central and eastern equatorial Pacific Ocean [Fig. 4]. Tropical atmospheric anomalies were also consistent with El Niño. Over the east-central Pacific, low-level winds were anomalously westerly, while upper-level winds were anomalously easterly. Convection was slightly enhanced around the International Date Line, stretching into the eastern Pacific, just north of the equator. Convection was mostly suppressed around Indonesia [Fig. 5]. The equatorial Southern Oscillation Index (SOI) and the traditional station-based SOI were both significantly negative. Collectively, the coupled ocean-atmosphere system reflected El Niño.
El Niño Winter
The most recent IRI plume indicates El Niño will persist through the Northern Hemisphere winter 2023-24 [Fig. 6]. Despite nearly the same ensemble mean amplitude as last month, the shorter forecast horizon means that the odds of at least a “strong” El Niño (≥1.5°C for the November-January seasonal average in Niño-3.4) have increased to 71%. However, a strong El Niño does not necessarily equate to strong impacts locally, with the odds of related climate anomalies often lower than the chances of El Niño itself (e.g., CPC’s seasonal outlooks). In summary, El Niño is anticipated to continue through the Northern Hemisphere winter (with greater than 95% chance through January – March 2024; [Fig. 7]).
Next El Niño update in October
This discussion is a consolidated effort of the National Oceanic and Atmospheric Administration (NOAA), NOAA’s National Weather Service, and their funded institutions. Oceanic and atmospheric conditions are updated weekly on the Climate Prediction Center web site (El Niño/La Niña Current Conditions and Expert Discussions). Additional perspectives and analysis are also available in an ENSO blog. A probabilistic strength forecast is available here. The next ENSO Diagnostics Discussion is scheduled for 12 October 2023.

El Niño is anticipated to continue through the Northern Hemisphere winter (with a greater than 95% chance through January – March 2024). An El Niño Advisory remains in effect. Graphic: NOAA
Full discussion on the latest El Niño update from the National Weather Service Climate Prediction Center: www.cpc.ncep.noaa.gov/products/analysis_monitoring/enso_advisory/ensodisc.shtml


