Water recycling reduces the need to import or develop additional drinking water supplies. It is a vital water management strategy to ensure a safe, reliable, and locally controlled water supply to support healthy environments, robust economies, and high quality of life.
Water and wastewater agencies in San Diego County are developing or expanding their water recycling infrastructure. Among those at the forefront is the Olivenhain Municipal Water District. OMWD marks a significant milestone in August: the 20th anniversary of its award-winning 4S Ranch Water Reclamation Facility, which began serving high-quality recycled water for irrigation in August 2003.
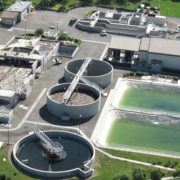
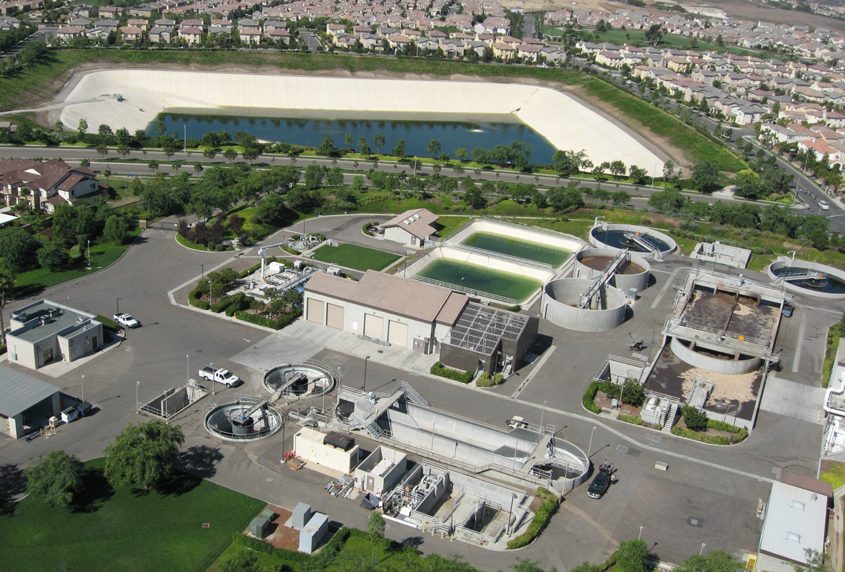
The Olivenhain Municipal Water District’s award-winning 4S Ranch Water Reclamation Facility celebrates its 20th anniversary in August 2023. Photo: Olivenhain Municipal Water District
OMWD annexed the 4S Ranch and Rancho Cielo Sanitation Districts from the County of San Diego in 1998. OMWD also took ownership of a small wastewater treatment facility in 4S Ranch. This facility had the capability to treat 0.25 million gallons per day (MGD) of wastewater from the surrounding commercial center and condominium complex. Treated wastewater was disposed of by spraying it on nearby unimproved pastures.
Recognizing the significant development plans for the 4S Ranch area, OMWD expanded the capacity of the facility to 2.0 MGD. As part of this expansion, OMWD also incorporated additional treatment phases of filtration and ultraviolet disinfection, improving water quality. OMWD required area developers to install the entire recycled water infrastructure for their planned communities.
Today, the facility produces over one million gallons of recycled water per day. It is delivered to irrigation customers in the southeastern portion of OMWD’s service area for use at HOA common areas, schools, parks, streetscapes, and golf courses. Together with recycled water purchased from nearby water and wastewater agencies to serve customers in portions of Encinitas and Carlsbad, OMWD now serves up to 15 percent of its customers’ total water demand with recycled water.
“For 20 years, OMWD has proudly served 4S Ranch and neighboring communities with high-quality recycled water, reducing the use of drinking water for irrigation,” said OMWD Vice President Matthew Hahn. “As California continues to face water supply challenges, the expansion of our recycled water system strengthens our water supply reliability and promotes sustainable water management.
How water recycling helps build water reliability
OMWD serves up to 15% of its overall demand from recycled water treated through its award-winning 4S Ranch facility. Photo: Olivenhain Municipal Water District
Water recycling is the process of capturing and treating wastewater, for non-domestic purposes such as irrigation and industrial processes.
Water and wastewater agencies across San Diego County are developing or expanding their recycled water systems to reduce the need to import or develop other supplies.
Since 2003, OMWD has significantly increased its recycled water purchases through connections with neighboring agencies, including the City of San Diego, San Elijo Joint Powers Authority, Rancho Santa Fe Community Services District, and Vallecitos Water District. OMWD now serves over two and a half million gallons of recycled water every day. Each year, OMWD installs additional recycled water pipelines and converts more customers from potable water to recycled water.
By 2027, the volume of recycled water produced in the U.S. is projected to increase 37% from 4.8 billion gallons per day to 6.6 billion gallons per day, according to a recent survey by Bluefield Research.
OMWD leadership in developing water recycling
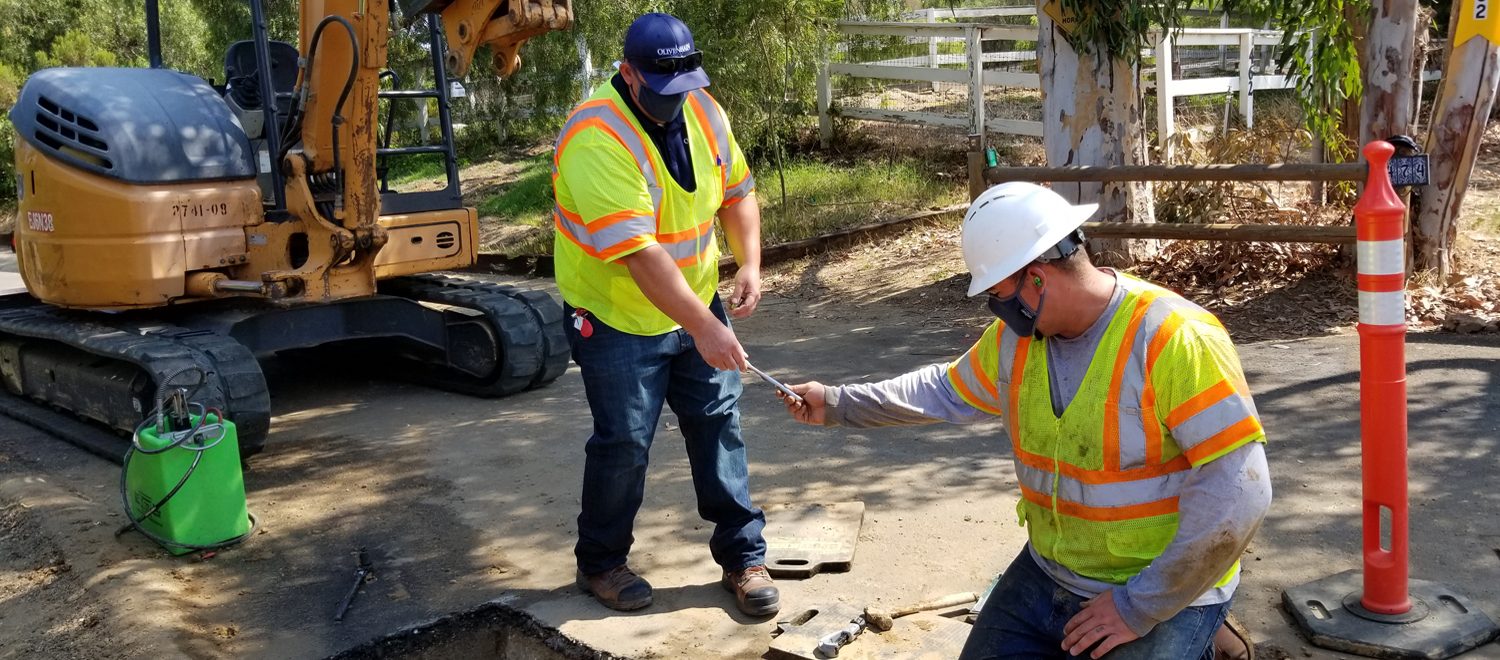
In 2021, the Olivenhain Municipal Water District completed several replacement and upgrade projects at its 4S Ranch Water Reclamation Facility. Photo: Olivenhain Municipal Water District
As a founding member of the North San Diego Water Reuse Coalition, OMWD works with nine northern San Diego County water and wastewater agencies across jurisdictional boundaries to reduce the impact of water supply shortages on San Diego County’s $268 billion economy. This regional approach has proven successful in developing local projects as well as obtaining $9 million in funding, significantly reducing the costs of water recycling projects for North San Diego County water ratepayers.
In addition, the Coalition has also secured federal funding of $23.8 million to help cover costs for water reclamation projects through 2025.
Expanding capacity for the future
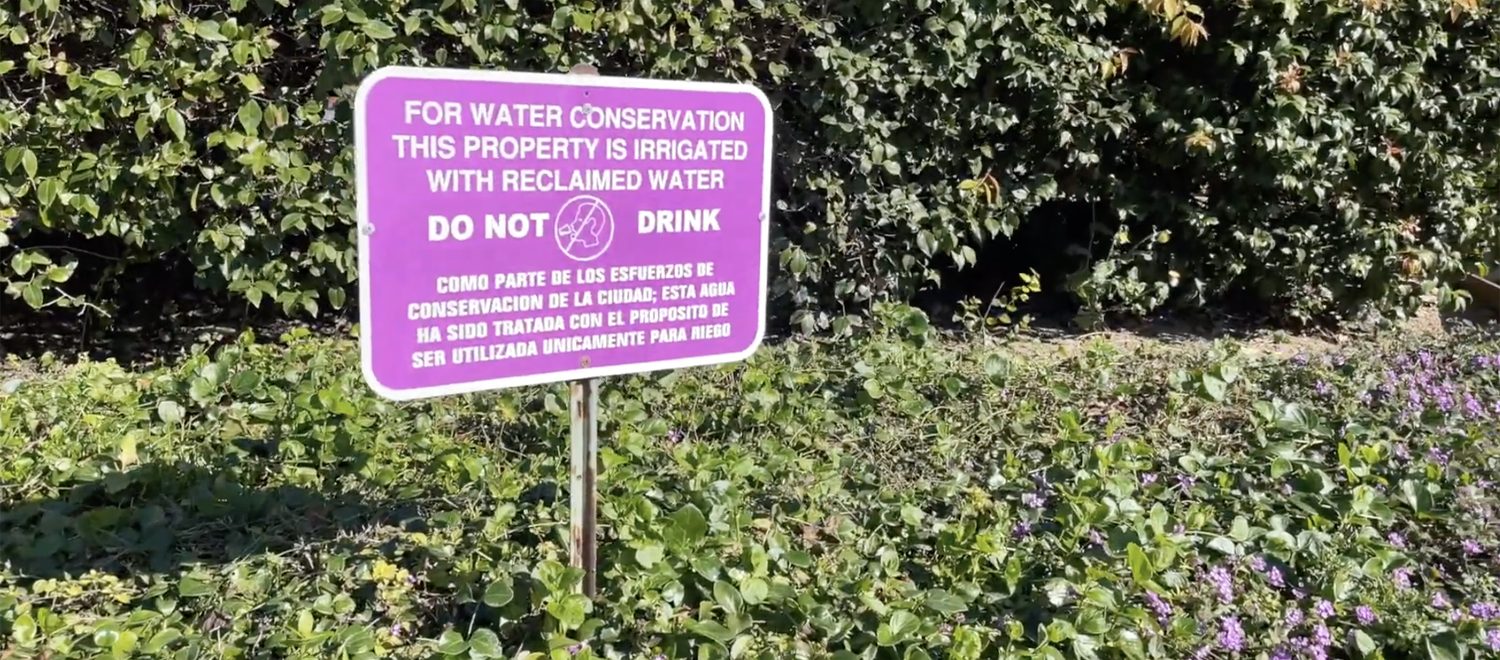
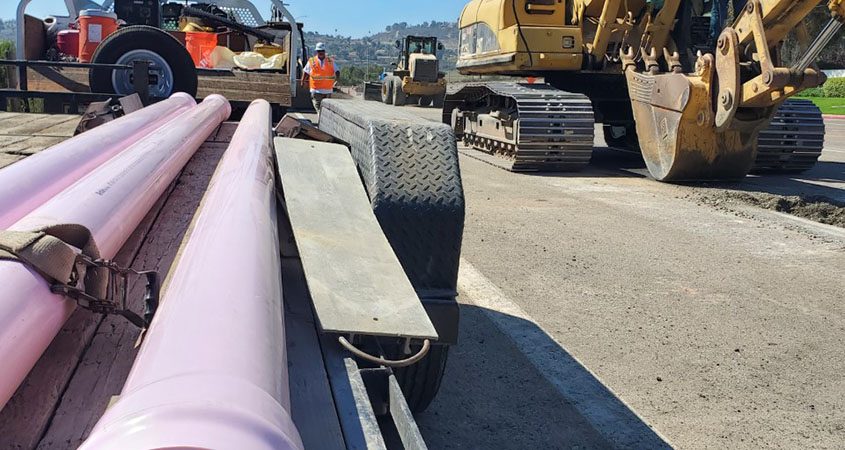
Water and wastewater agencies across San Diego County including OMWD are developing or expanding water recycling projects, because every gallon of recycled water reduces the need to import or develop other supplies. Photo: Olivenhain Municipal Water District
As it looks forward to the next 20 years, OMWD continues to expand its recycled water capacity. It began construction this summer on three recycled water pipelines near Calle Barcelona in Carlsbad and in Village Park in Encinitas. Once complete, OMWD can convert up to 27 meters to recycled water, offsetting 12.7 million gallons of potable water used annually for irrigation.
OMWD has long pursued alternative water supplies like recycled water, a reliable, drought-proof approach for complementing existing water sources.
The San Diego County Water Authority has supported the development of recycling projects for decades, through membership in groups such as the WateReuse Association and collaborative efforts to promote local reuse efforts. Approximately 35,000 acre-feet of recycled water is beneficially reused within the Water Authority’s service area annually, and the volume is expected to continue growing as new and expanded plants come online.
(Editor’s note: The Olivenhain Municipal Water District is one of the San Diego County Water Authority’s 24 member agencies that deliver water across the San Diego County region.)


 Sweetwater Authority Logo 2019