The East County Advanced Water Purification project is progressing, with construction underway at multiple East San Diego County locations.
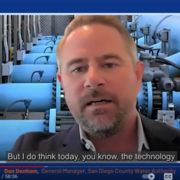
The project will create a new, local, sustainable, and drought-proof water supply using state-of-the-art technology to purify East San Diego County’s recycled water. Construction for the East County AWP is expected to be completed in 2025, and water production will begin in 2026. When completed, the project is expected to provide approximately 30% of current drinking water demands for East San Diego County residents and businesses.
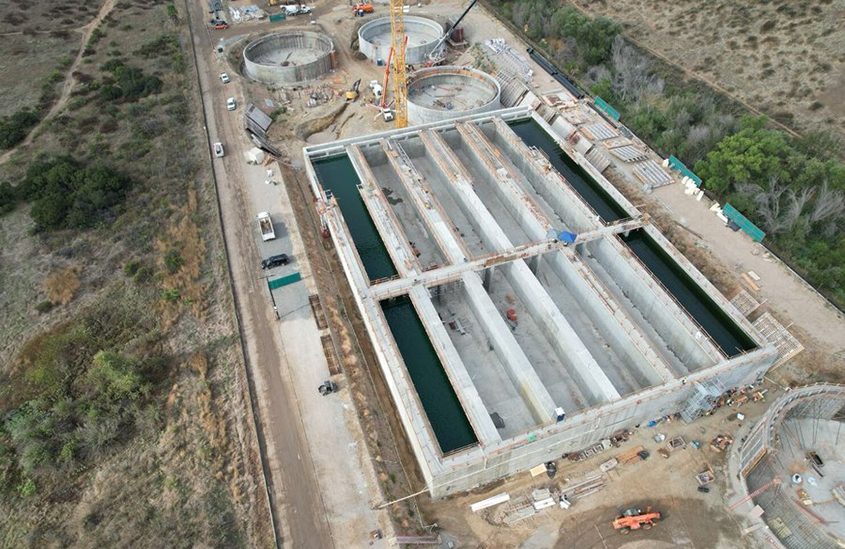
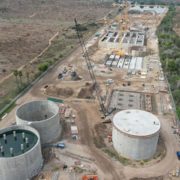
When completed, the water recycling facility can treat 16 million gallons of water per day (MGD). The advanced water purification facility will be able to process 11.5 MGD. Photo: East County AWP
Water treatment facilities are under construction north of Santee Lakes. Concrete work is underway on the water recycling and solids handling facilities. About 24,000 cubic yards of concrete have been poured, marking nearly 50% of the total concrete used at this site. Once complete, there will be enough concrete to fill 16 Olympic-sized swimming pools.

Crews at the East County AWP construction site in Santee found this friendly tarantula. More tarantulas emerge from hiding as mating season is in full swing across San Diego County. Photo East County AWP
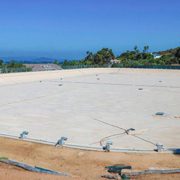
The advanced water purification facility and visitors center are also taking shape with the installation of underground piping and conduits.
When completed, the water recycling facility can treat 16 million gallons of water per day (MGD). The advanced water purification facility will be able to process 11.5 MGD.
Time lapse video of the project
Pipeline construction in Santee
Pipeline construction continues on Fanita Parkway north of Ganley in Santee. Biking and hiking access to the trails north of Ganley are temporarily located at the end of Strathmore to provide a safe space for construction.
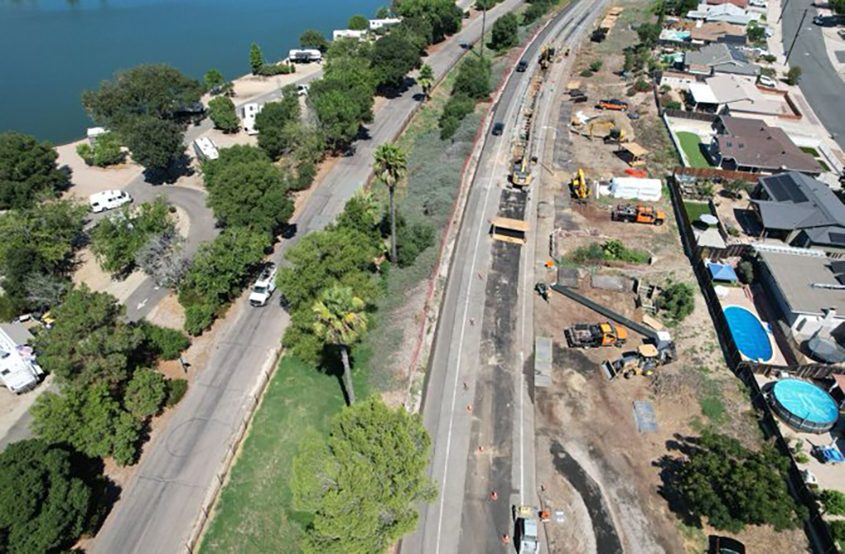
Pipeline construction along Fanita Parkway north of Santee Lakes. Photo: East County AWP
The purified water pipeline will travel east through Santee and Lakeside, ending at Lake Jennings. Two additional pipelines will be constructed south of the new facilities past Carlton Oaks Drive to a pump station just south of the Carlton Oaks Golf Course.
Most pipeline work will be trenched, placed, and covered, while the remainder will be installed using trenchless technologies and methods. There may be some impacts from construction, including road travel delays. Construction hours vary depending on the project elements being completed.
The purified water pipeline running from the advanced water purification facility north of Santee Lakes to Lake Jennings is 10.2 miles long.
Interactive construction map
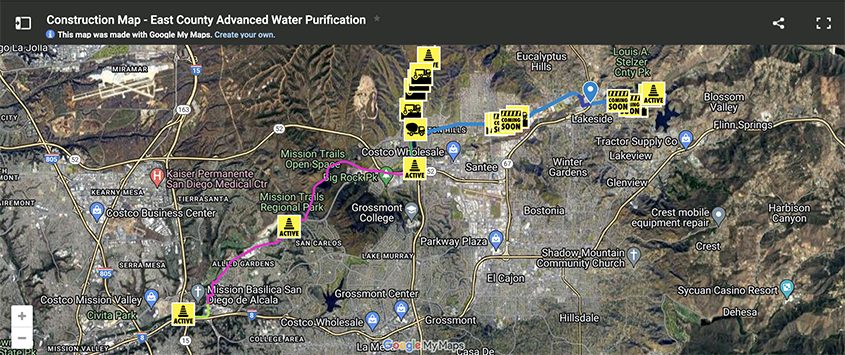
An interactive construction map tracks project construction sites and work progress. Photo: East County AWP
An interactive map allows viewers to zoom in and click on project areas to find active construction zones, schedules, work hours, and other information. Communication will include mailers, email updates, road signs, interactive maps, webpage updates, and presentations to community groups throughout the project area.
Groundbreaking ceremony in 2022
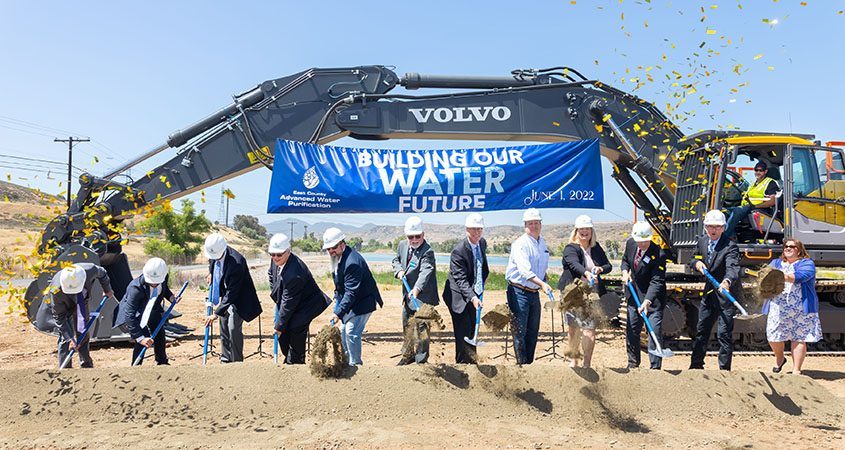
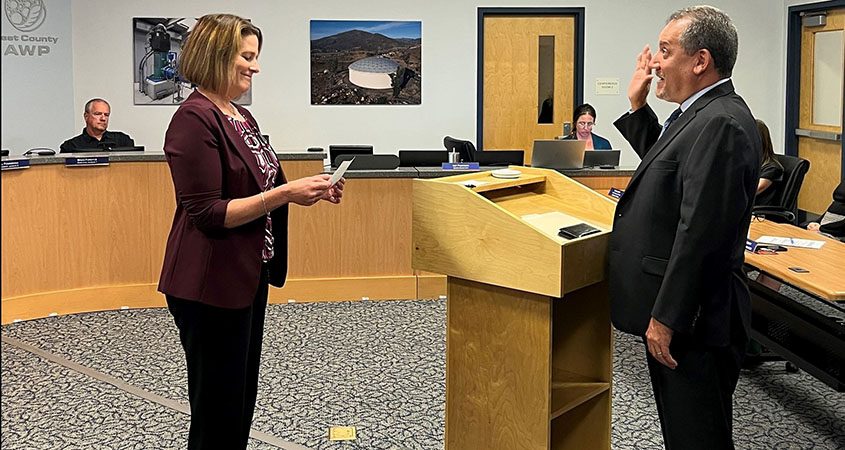
The East County Advanced Water Purification Program broke ground on June 1, 2022, marking an important milestone for the recycled water project in San Diego County. Photo: San Diego County Water Authority
The June 2022 groundbreaking followed the approval of project construction on May 19, 2022, by the East County AWP Joint Powers Authority that owns and operates the Program. The Joint Powers Authority is a collaborative partnership between four agencies: Padre Dam, the City of El Cajon, the County of San Diego and Helix Water District. The project is estimated to create 2,500 jobs in the region.
East County Advanced Water Purification Program
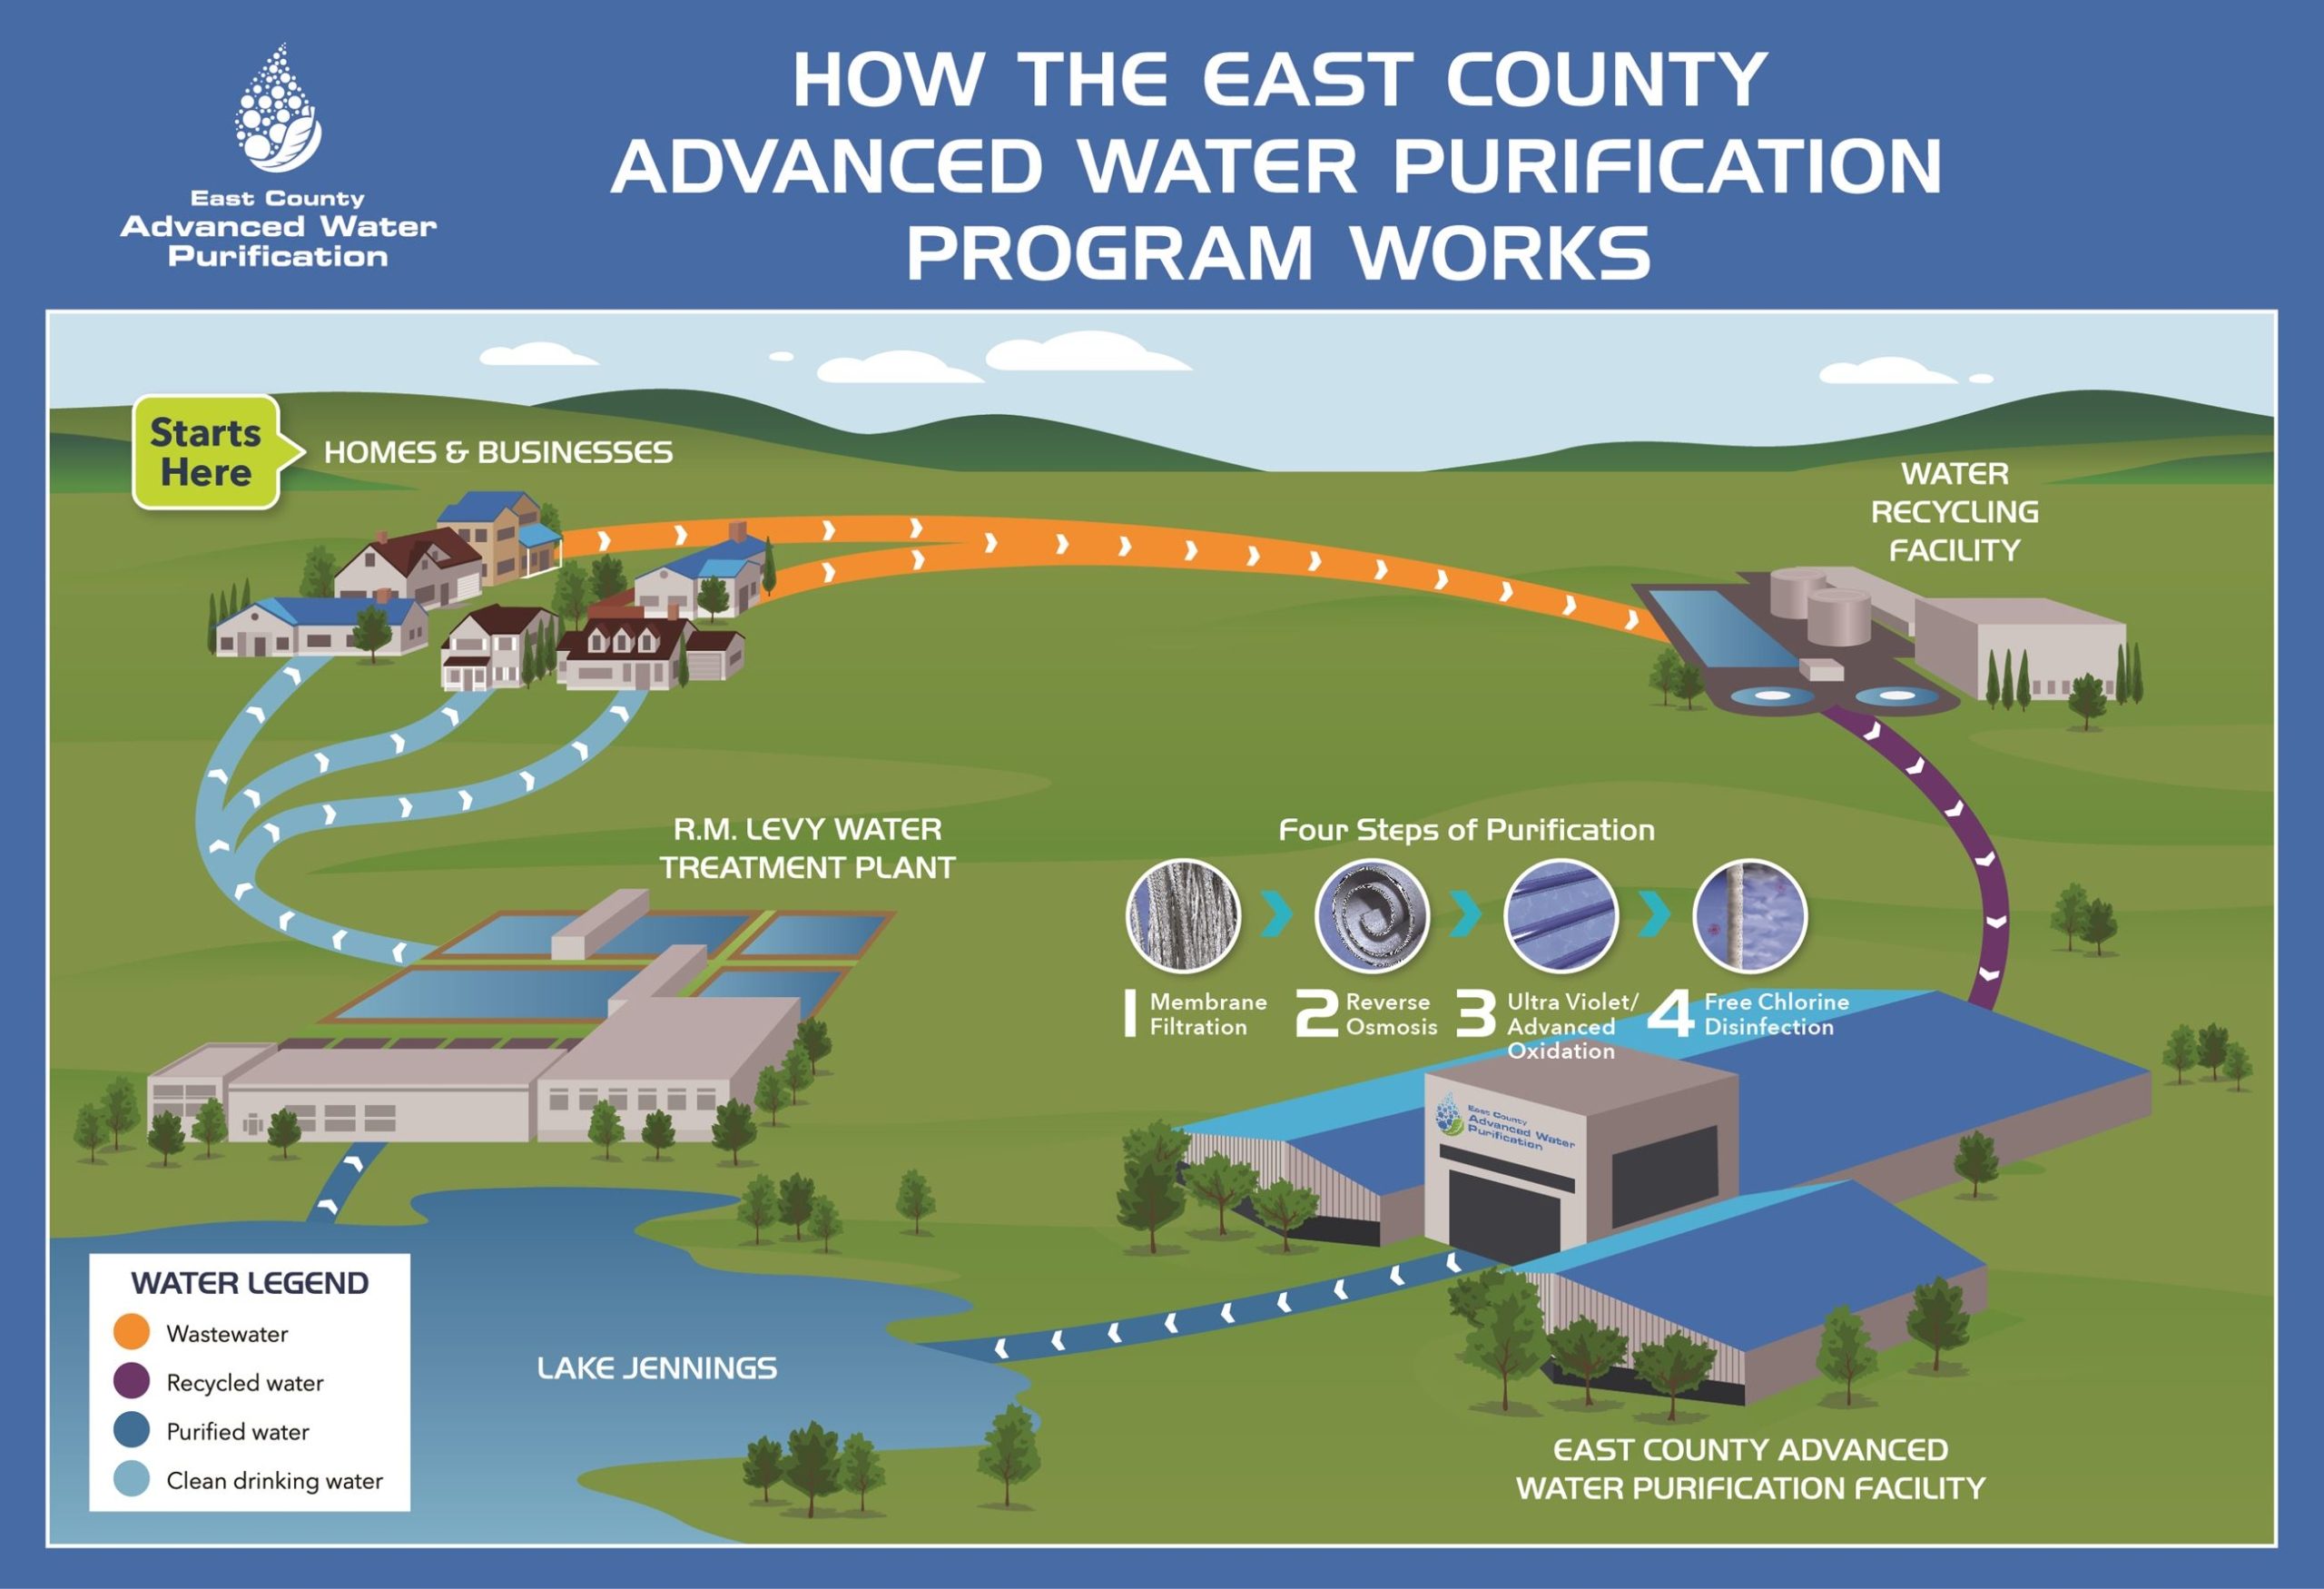
The East County Advanced Water Purification Program will create a new, local, sustainable and drought-proof drinking water supply by using state-of-the-art technology to purify East San Diego County’s recycled water to produce up to 30% of East County’s drinking water supply. Graphic: East County AWP
(Editor’s note: The Padre Dam Municipal Water District and the Helix Water District are two of the San Diego County Water Authority’s 24 member agencies that deliver water across the metropolitan San Diego region.)

 Sweetwater Authority Logo 2019