Posts

September Sizzled to Records and Was So Much Warmer Than Average Scientists Call It ‘Mind-Blowing’

After a summer of record-smashing heat, warming somehow got even worse in September as Earth set a new mark for how far above normal temperatures were, the European climate agency reported Thursday.

Last month’s average temperature was 0.93 degrees Celsius (1.7 degrees Fahrenheit) above the 1991-2020 average for September. That’s the warmest margin above average for a month in 83 years of records kept by the European Space Agency’s Copernicus Climate Change Service.

“It’s just mind-blowing really,” said Copernicus Director Carlo Buontempo. “Never seen anything like that in any month in our records.”

An Atmospheric River Will Drench Northern California Early This Week — But Entirely Miss Greater San Diego

An atmospheric river will bring significant rain to Northern California Monday and Tuesday but entirely miss San Diego County, which is days away from wrapping up an otherwise wet year, the National Weather Service said.

But there will be a slight chill to the air along the San Diego coastline — the kind that reminds people that it’s a good idea to keep a sweater handy. And you’ll need your winter wetsuit before long.

San Diego County Water Authority Honored for Climate Change Efforts

The San Diego County Water Authority has earned Climate Registered gold status from The Climate Registry for the fourth consecutive year. The Water Authority was recognized for verifying and publicly reporting its greenhouse gas emissions, an effort that fosters transparency for the agency’s climate mitigation initiatives and helps the agency track and validate emissions reductions in the future.

San Diego County Water Authority honored-The Climate Registry-Water Authority honored-Climate Change

San Diego County Water Authority Honored for Climate Change Efforts

The San Diego County Water Authority has earned Climate Registered gold status from The Climate Registry for the fourth consecutive year. The Water Authority was recognized for verifying and publicly reporting its greenhouse gas emissions, an effort that fosters transparency for the agency’s climate mitigation initiatives and helps the agency track and validate emissions reductions in the future.

The Climate Registry operates North America’s largest voluntary registry for greenhouse gas (GHG) emissions. The Water Authority’s 2021 and 2022 inventories were verified and published in The Climate Registry’s public database in July and September, earning the agency gold status for both years. The agency also published its 2019 and 2020 inventories, earning the Water Authority gold status for those years. In addition, the Water Authority has met all California state aligned GHG reduction targets, while decreasing its emissions over the past 13 years compared to its state-aligned baseline year.

“Reducing greenhouse gas emissions is a key part of the Water Authority’s Climate Action Plan and our commitment to the environment,” said Water Authority Board Chair Mel Katz. “As a climate leader, we continue to develop forward-thinking solutions that increase our contribution to energy and water efficiency efforts across the state.”

The Water Authority works with its 24 member agencies to deliver safe and reliable water supplies across San Diego County. Sustainability has been an important part of the agency’s commitment for years. Water-use efficiency not only lessens the Water Authority’s dependence on imported water, but it also reduces energy costs and the greenhouse gas emissions associated with transporting and treating water.

Climate Action Plan

As a centerpiece of its sustainability efforts, in 2014 the Water Authority voluntarily developed a Climate Action Plan and updates it every five years, comparing GHG emissions against a baseline and tracking progress toward State of California goals. Since the plan’s adoption, the Water Authority has conducted annual GHG inventories and provides updates to the Board of Directors. Verification of the annual inventory by a third-party is another step toward validating the Water Authority’s climate mitigation efforts for stakeholders.

The Climate Registry is a nonprofit organization governed by U.S. states and Canadian provinces and territories. The registry designs and operates voluntary GHG reporting programs globally, and assists organizations in measuring, reporting and verifying the carbon in their operations to manage and reduce it. The registry also builds capacity for emissions reductions by government agencies, and spearheads innovative projects such as the Water-Energy Nexus Registry.

“The San Diego County Water Authority’s continued achievement of Climate Registered gold status through reporting years 2021 and 2022 demonstrates sustained and consistent leadership in emissions disclosure,” said Charles Pope, Director of Registry Services for The Climate Registry. “The Climate Registry is proud to recognize SDCWA’s extraordinary commitment to transparency, which sets a clear example for all organizations in California.”

(Editor’s note: For more information about the Water Authority’s sustainability initiative, go to: www.sdcwa.org/projects-programs/programs/environmental/.)

El Niño-NOAA-Northern Hemisphere-Winter

El Niño Anticipated to Continue Through the Northern Hemisphere Winter

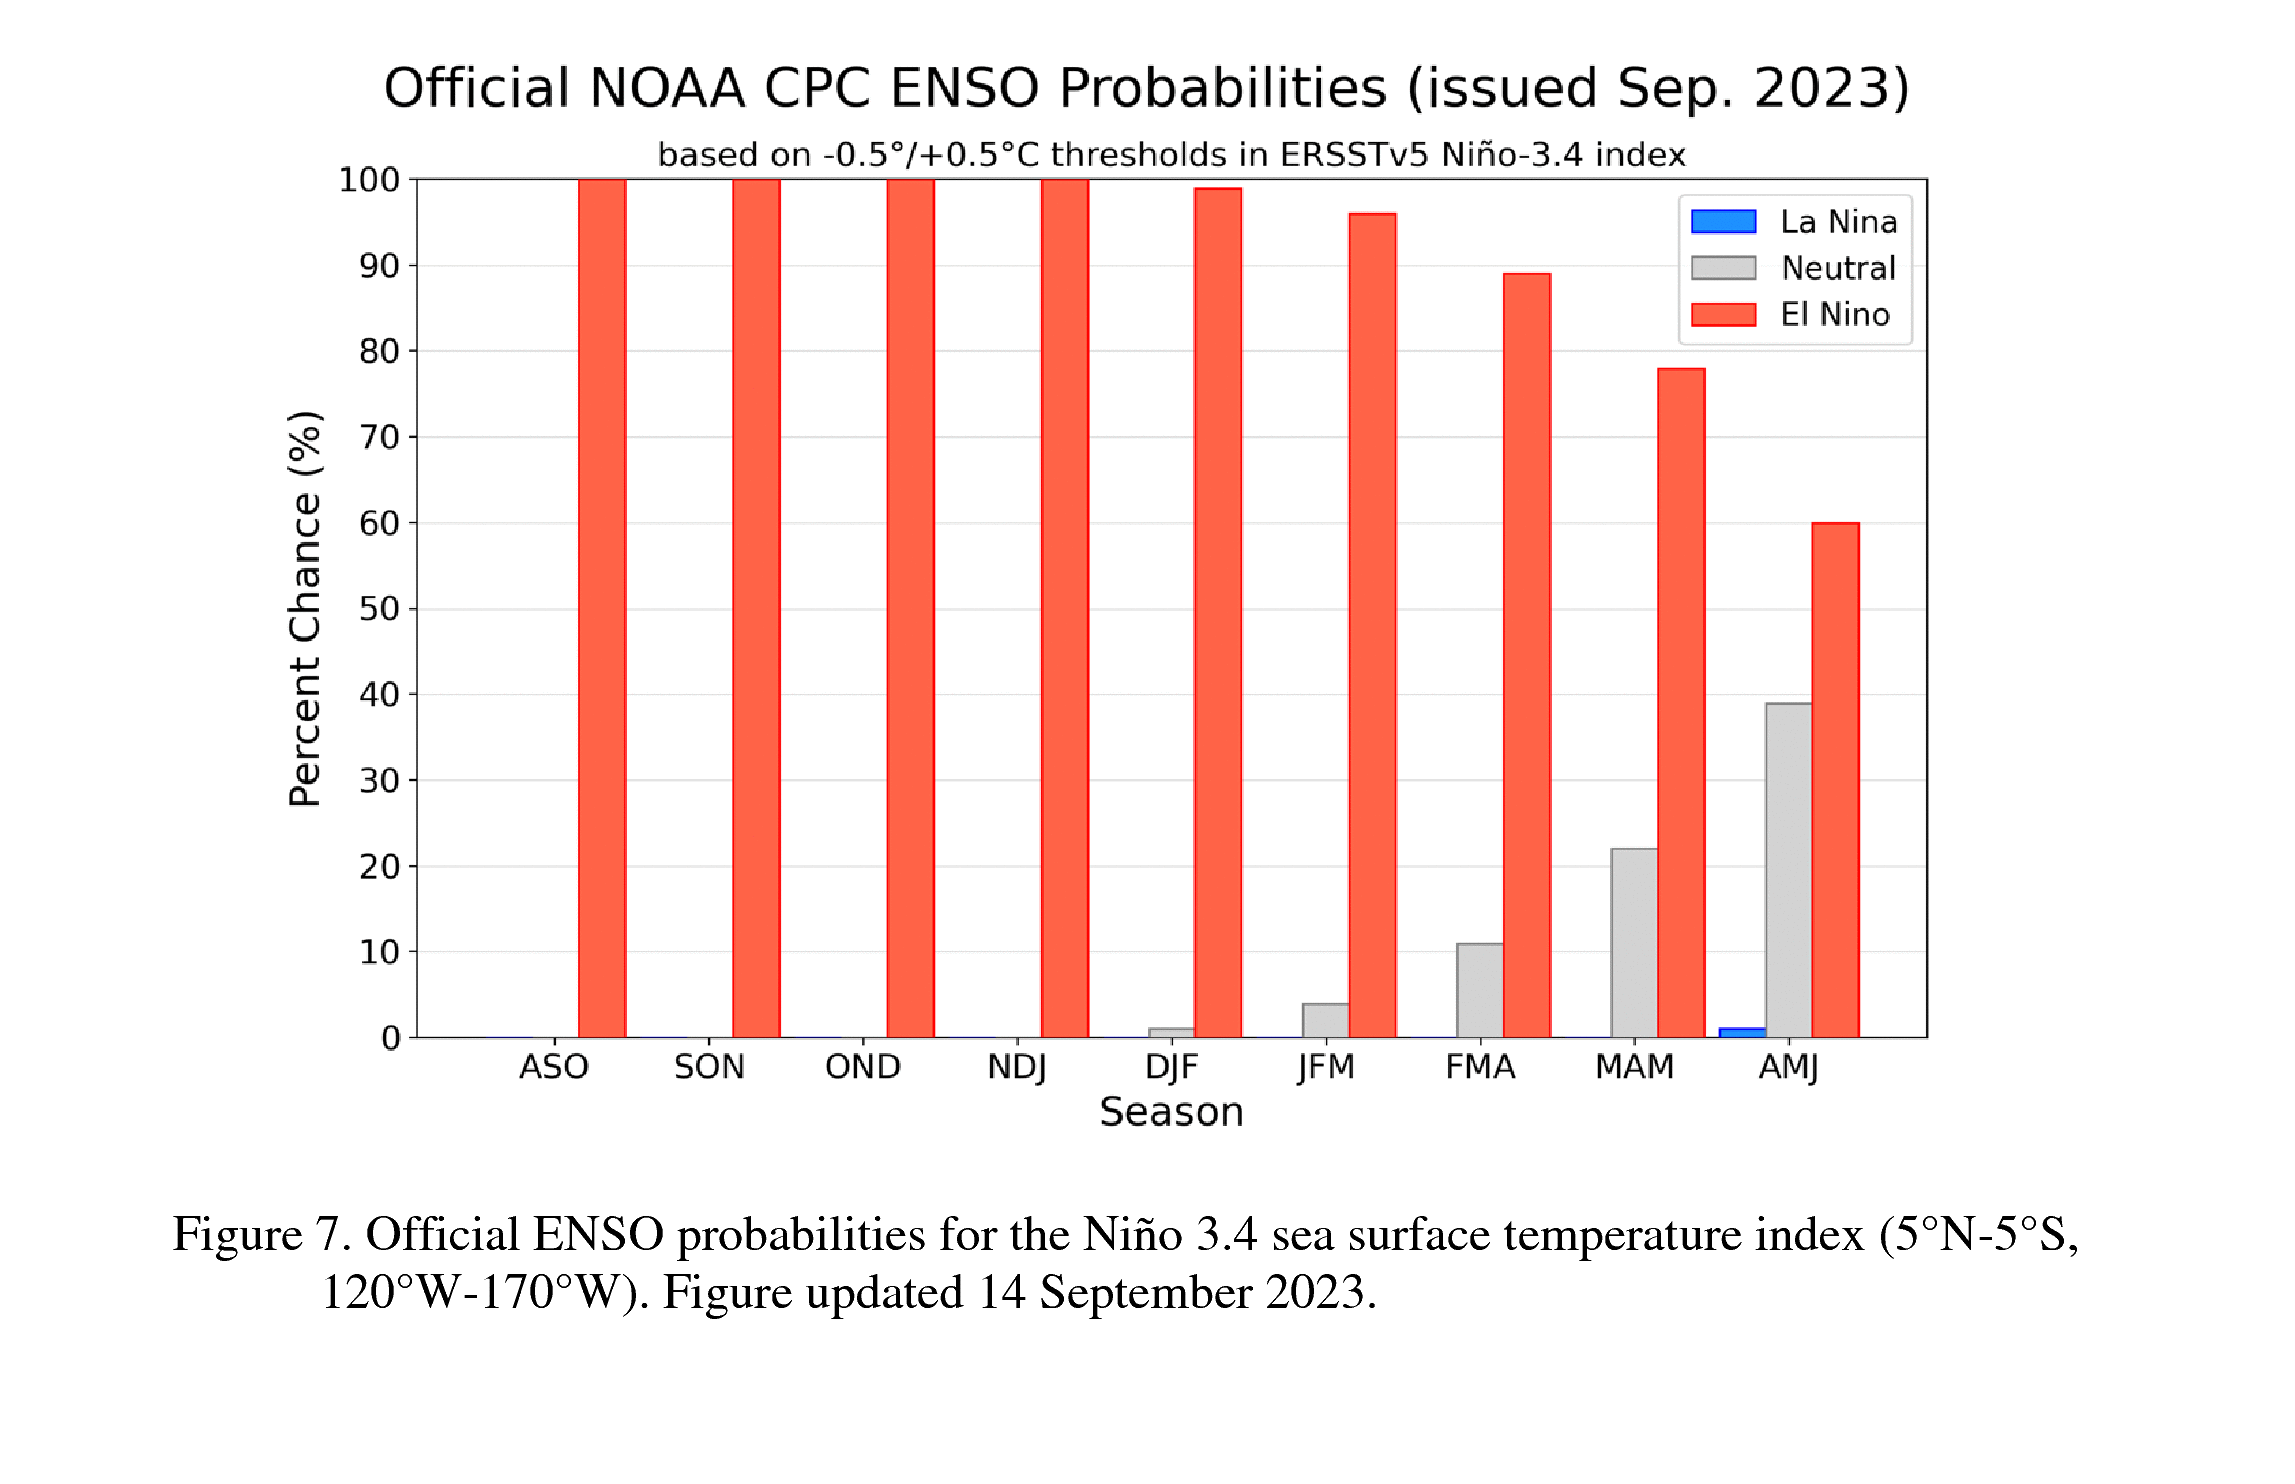
El Niño is anticipated to continue through the Northern Hemisphere winter (with a greater than 95% chance through January – March 2024). An El Niño Advisory remains in effect.

In August, sea surface temperatures (SSTs) were above average across the equatorial Pacific Ocean [Fig. 1], with strengthening in the central and east-central Pacific. All of the latest weekly Niño indices were in excess of +1.0°C: Niño-4 was +1.1°C, Niño-3.4 was +1.6°C, Niño-3 was +2.2°C, and Niño1+2 was +2.9°C [Fig. 2]. Area-averaged subsurface temperatures anomalies increased compared to July [Fig. 3] in association with anomalous warmth in the central and eastern equatorial Pacific Ocean [Fig. 4]. Tropical atmospheric anomalies were also consistent with El Niño. Over the east-central Pacific, low-level winds were anomalously westerly, while upper-level winds were anomalously easterly. Convection was slightly enhanced around the International Date Line, stretching into the eastern Pacific, just north of the equator. Convection was mostly suppressed around Indonesia [Fig. 5]. The equatorial Southern Oscillation Index (SOI) and the traditional station-based SOI were both significantly negative. Collectively, the coupled ocean-atmosphere system reflected El Niño.

El Niño Winter

The most recent IRI plume indicates El Niño will persist through the Northern Hemisphere winter 2023-24 [Fig. 6]. Despite nearly the same ensemble mean amplitude as last month, the shorter forecast horizon means that the odds of at least a “strong” El Niño (≥1.5°C for the November-January seasonal average in Niño-3.4) have increased to 71%. However, a strong El Niño does not necessarily equate to strong impacts locally, with the odds of related climate anomalies often lower than the chances of El Niño itself (e.g., CPC’s seasonal outlooks). In summary, El Niño is anticipated to continue through the Northern Hemisphere winter (with greater than 95% chance through January – March 2024; [Fig. 7]).

El Niño-NOAA-Northern Hemisphere-Winter

El Niño Anticipated to Continue Through the Northern Hemisphere Winter

El Niño is anticipated to continue through the Northern Hemisphere winter (with a greater than 95% chance through January – March 2024). An El Niño Advisory remains in effect.

In August, sea surface temperatures (SSTs) were above average across the equatorial Pacific Ocean [Fig. 1], with strengthening in the central and east-central Pacific. All of the latest weekly Niño indices were in excess of +1.0°C: Niño-4 was +1.1°C, Niño-3.4 was +1.6°C, Niño-3 was +2.2°C, and Niño1+2 was +2.9°C [Fig. 2]. Area-averaged subsurface temperatures anomalies increased compared to July [Fig. 3] in association with anomalous warmth in the central and eastern equatorial Pacific Ocean [Fig. 4]. Tropical atmospheric anomalies were also consistent with El Niño. Over the east-central Pacific, low-level winds were anomalously westerly, while upper-level winds were anomalously easterly. Convection was slightly enhanced around the International Date Line, stretching into the eastern Pacific, just north of the equator. Convection was mostly suppressed around Indonesia [Fig. 5]. The equatorial Southern Oscillation Index (SOI) and the traditional station-based SOI were both significantly negative. Collectively, the coupled ocean-atmosphere system reflected El Niño.

El Niño Winter

The most recent IRI plume indicates El Niño will persist through the Northern Hemisphere winter 2023-24 [Fig. 6]. Despite nearly the same ensemble mean amplitude as last month, the shorter forecast horizon means that the odds of at least a “strong” El Niño (≥1.5°C for the November-January seasonal average in Niño-3.4) have increased to 71%. However, a strong El Niño does not necessarily equate to strong impacts locally, with the odds of related climate anomalies often lower than the chances of El Niño itself (e.g., CPC’s seasonal outlooks). In summary, El Niño is anticipated to continue through the Northern Hemisphere winter (with greater than 95% chance through January – March 2024; [Fig. 7]).

Next El Niño update in October

This discussion is a consolidated effort of the National Oceanic and Atmospheric Administration (NOAA), NOAA’s National Weather Service, and their funded institutions. Oceanic and atmospheric conditions are updated weekly on the Climate Prediction Center web site (El Niño/La Niña Current Conditions and Expert Discussions). Additional perspectives and analysis are also available in an ENSO blog. A probabilistic strength forecast is available here. The next ENSO Diagnostics Discussion is scheduled for 12 October 2023.

El Niño

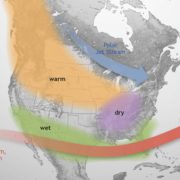
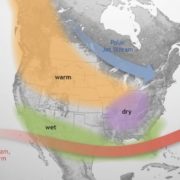
El Niño is anticipated to continue through the Northern Hemisphere winter (with a greater than 95% chance through January – March 2024). An El Niño Advisory remains in effect. Graphic: NOAA

Full discussion on the latest El Niño update from the National Weather Service Climate Prediction Center: www.cpc.ncep.noaa.gov/products/analysis_monitoring/enso_advisory/ensodisc.shtml


El Niño is Coming This Winter. The Question is, Will It Be a Whopper?

San Diego County’s fragile shoreline and vulnerable beachfront properties could be in for a rough winter, according to the California Coastal Commission, the National Weather Service and some top San Diego scientists.

“We are looking at an emerging El Niño event,” staff geologist Joseph Street told the Coastal Commission at its meeting Wednesday in Eureka.

This Summer Broke the World Record for the Highest Temperature Officially Recorded

Earth has sweltered through its hottest Northern Hemisphere summer ever measured, with a record warm August capping a season of brutal and deadly temperatures, according to the World Meteorological Organization.

Last month was not only the hottest August scientists ever recorded by far with modern equipment, it was also the second hottest month measured, behind only July 2023, WMO and the European climate service Copernicus announced Wednesday.

snowmelt runoff-streamflow-records

Snowmelt Runoff Sets Streamflow Records in the Southwest

Across the western U.S., many areas received record or near-record amounts of snowpack over the winter. With the spring and summer temperatures melting the abundant snow, a record volume of streamflow has been recorded in several basins in the southwestern U.S., providing more water for the area later into the summer than is typically seen.

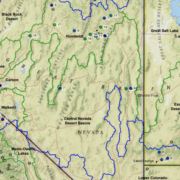
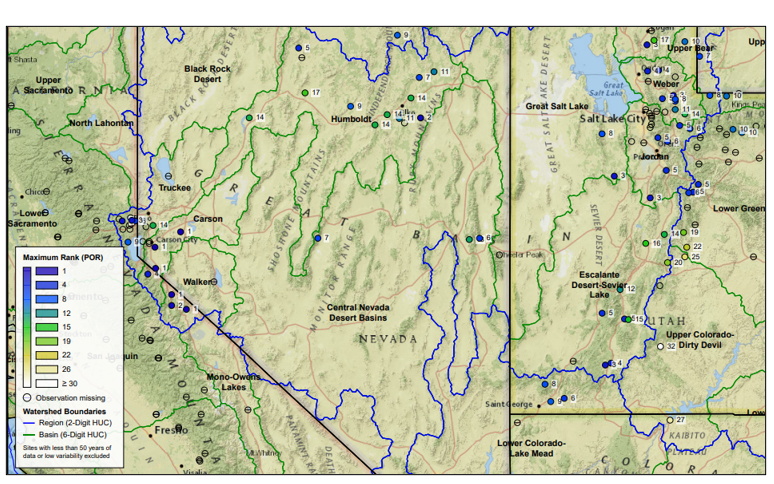
Snowmelt runoff in Walker and Carson basins

The Walker and Carson basins near the California-Nevada border, for example, have reported the largest volume of streamflow for April through July that has ever been observed in roughly a century, when the records began. The ample runoff is helping fill reservoirs that have been depleted from years of drought conditions.
Weekly U.S. Drought Monitor: Cooler Northwest, Warmer Southwest

Dry conditions dominated the West and southern Plains, coupled with above-normal temperatures. Precipitation was most widespread throughout much of the upper Midwest and central Plains and into the Northeast. Almost the entire country had near- to above-normal temperatures this last week, with the greatest departures over the Southwest and central Plains where temperatures were at least 4-7 degrees above normal.

Cooler-than-normal temperatures were recorded in the Pacific Northwest with departures of 3-6 degrees below normal. At the end of the current U.S. Drought Monitor period, significant rains developed over portions of the Midwest and central Plains, and they will be accounted for in the next analysis.

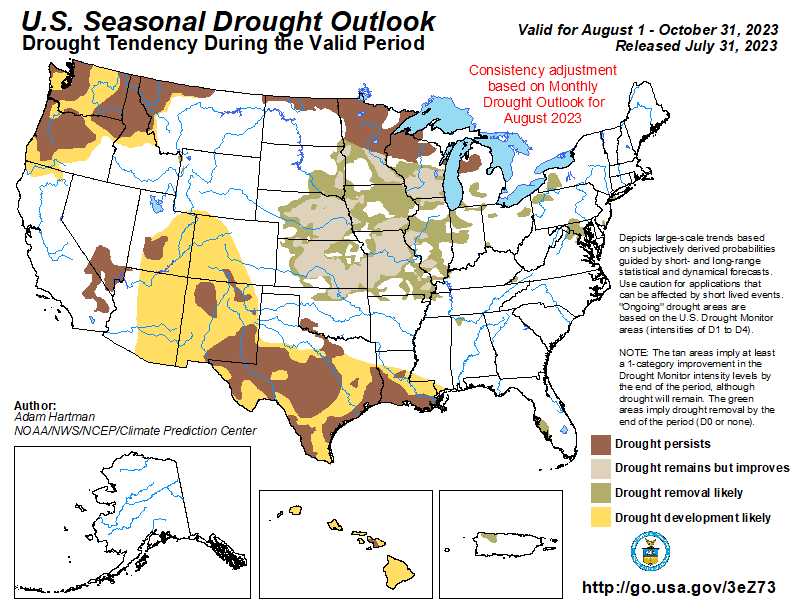
U.S. Seasonal Drought Outlook

Central portions of the Intermountain West may be spared degradation, as those areas are still showing residual benefits from above normal winter snowpack leading up to the summer, in addition to periods of above normal rainfall during the last 60 to 90 days. Seasonal temperature and precipitation outlooks, ENSO, and climatology favor widespread drought improvement and removal across the central U.S. However, drought persistence is favored across the Upper Midwest, although there is the potential for localized improvements.” Read full assessment: cpc.ncep.noaa.gov/products/expert_assessment/sdo_summary.php.
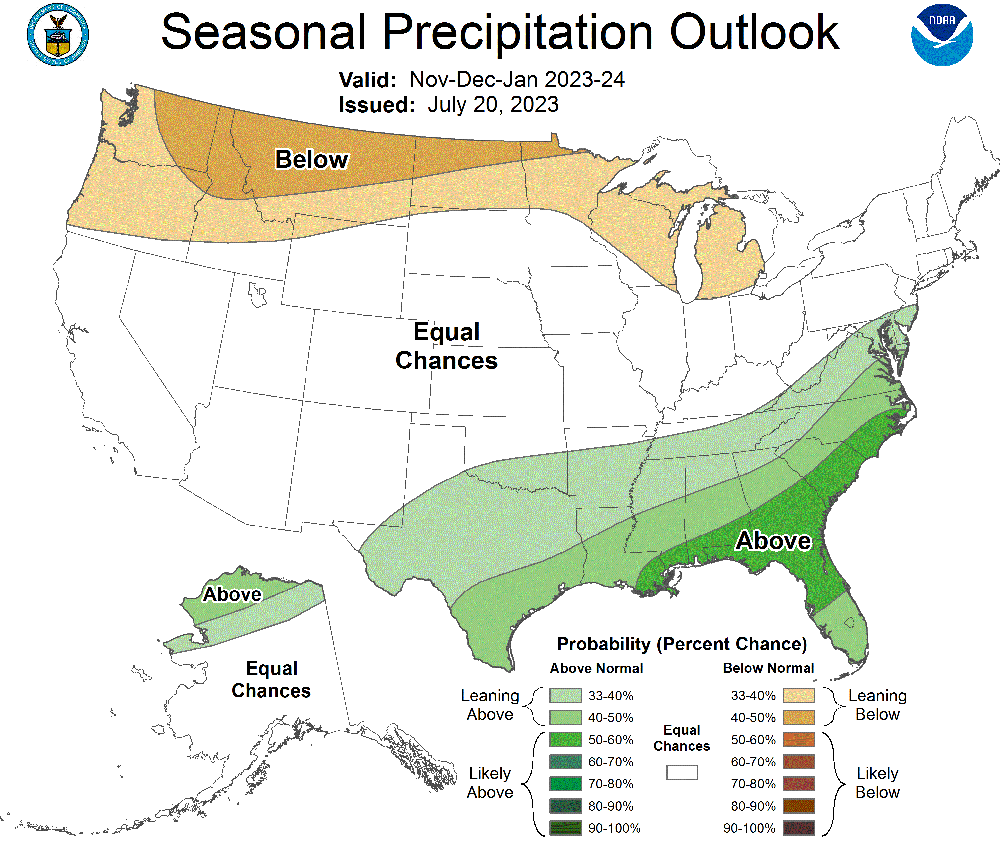
Seasonal Precipitation Outlook: November, December, January 2023-24

Colors show where total precipitation has an increased chance of being higher or lower than usual during the next three months. The darker the shading, the greater the chance for the indicated condition. White areas have equal chances for precipitation totals that are below, near, or above the long-term average (median) for the next three months.

Climate scientists base future climate outlooks on current patterns in the ocean and atmosphere. They examine projections from climate and weather models and consider recent trends. They also check historical records to see how much precipitation fell when patterns were similar in the past.
Copernicus Climate Change Service: July 2023 sees multiple global temperature records broken

July 2023 highlights:

  • The global average temperature for July 2023 is confirmed to be the highest on record for any month.
  • Antarctic sea ice extent continued to break records for the time of year, with a monthly value 15% below average, by far the lowest July extent since satellite observations began.
  • July 2023 was wetter than average over most of northern Europe and in a region from the Black Sea and Ukraine to northwestern Russia. Drier than average conditions were experienced across the Mediterranean basin, with Italy and southeastern Europe having the largest anomalies.

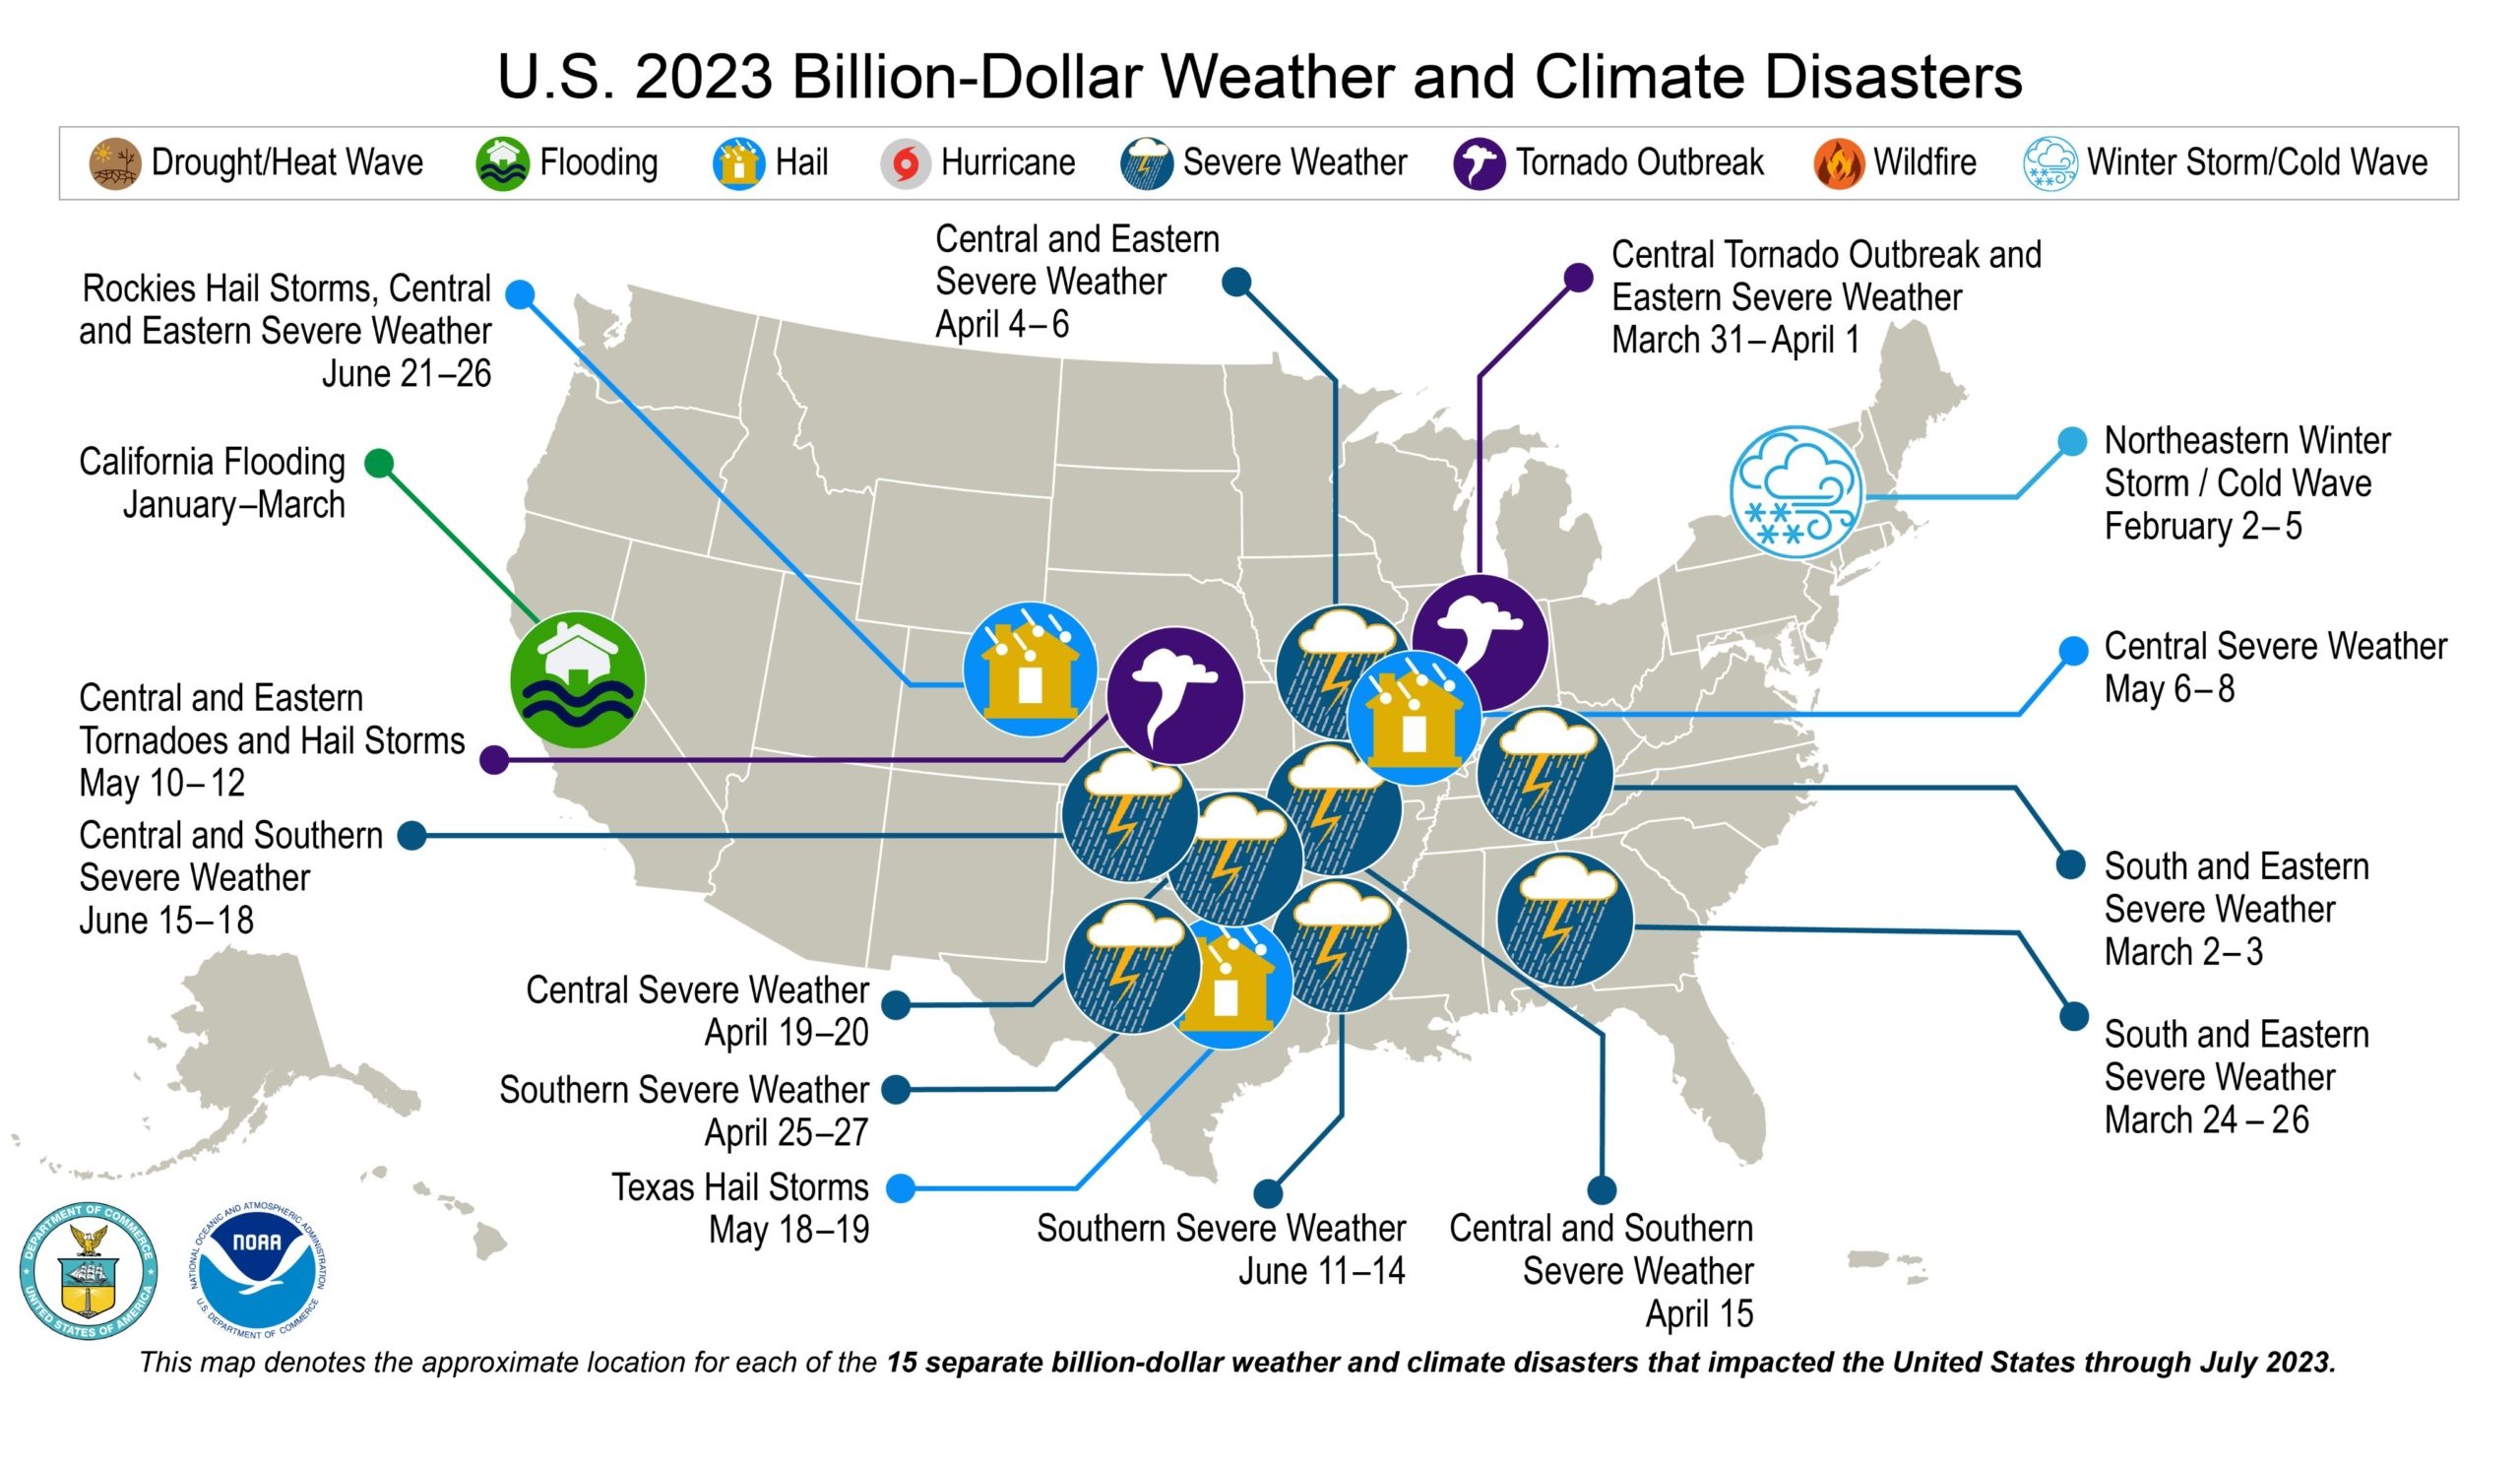
July 2023 NOAA State of Climate Report

Record-high temps & devastating floods struck the U.S. 15 separate billion-dollar disasters occurred during the 1st 7 months of 2023. More from NOAA’s July State of Climate report.
(Editor’s Note: Content for this story comes from the Natural Resources Conservation Service, which produces a weekly report using data and products from the National Water and Climate Center and other agencies. The report focuses on seasonal snowpack, precipitation, temperature, and drought conditions in the United States.)

How Much Snow Still Covers California’s Mountains This July?

In a typical year, California mountains are largely snow-free at this stage in the summer, with some exceptions at higher elevations. This, however, has not been a typical year. In the last couple of weeks of July, large swaths of the Sierra continued to be covered in snow, making for tricky and in some cases treacherous hiking conditions.