Tag Archive for: Climate Change

Here’s How California’s Flooding Risk Could Be Higher Than We Think

A national flood assessment tool could be out of date. A new study says this tool is not taking into account how many more severe events are happening because of climate change and how new construction could be at a higher risk.

Opinion: California’s Regulated Water Utilities Work Constantly to Provide Safe, Clean Water

Water is a precious resource, essential to life and requires our utmost care. As drought, climate change, wildfires and other natural disasters become more impactful, it is more important than ever that we are meeting our everyday and emergency water needs.

This Year’s Snow Season Wipes Away Drought in Much of the West

The 2022–2023 snow season started off relatively active across the West, with a few modest storms bringing snow accumulations to the mountains in early November. By the start of December, snow water equivalent across much of the region was above normal.

Feds Announce Start of Public Process to Reshape Key Rules on Colorado River Water Use by 2027

A public process started Thursday to reshape the way Colorado River water is distributed, with federal officials promising to collect comments about updating and enacting rules in 2027 to continue providing hydropower, drinking water and irrigation to farms, cities and tribes in seven Western U.S. states and Mexico.

The U.S. Interior Department said it will publish in the Federal Register on Friday a call for replacing guidelines that expire in 2026, including pacts enacted in 2007 for states to share cutbacks in water drawn from a river diminished by drought and climate change, as well as operating plans for the key Lake Powell and Lake Mead reservoirs. An agreement between the United States and Mexico on use of Colorado River water also is set to expire at that time.

The department’s U.S. Bureau of Reclamation promised a “robust and transparent public process” beginning with online virtual public meetings July 17July 18 and July 24. It set an Aug. 15 deadline for receipt of public comments on “specific operational guidelines, strategies and any other issues that should be considered.”

drought relief-snowpack-West-NIDIS winter update

This Year’s Snow Season Wipes Away Drought in Much of the West

The 2022–2023 snow season started off relatively active across the West, with a few modest storms bringing snow accumulations to the mountains in early November.

By the start of December, snow water equivalent (SWE) across much of the region was above normal. Starting in early December, several storm cycles brought moisture-laden families of atmospheric rivers to the West Coast. Most of the landfalls occurred in California. The strongest series of storms occurred steadily from December 27 through January 17.

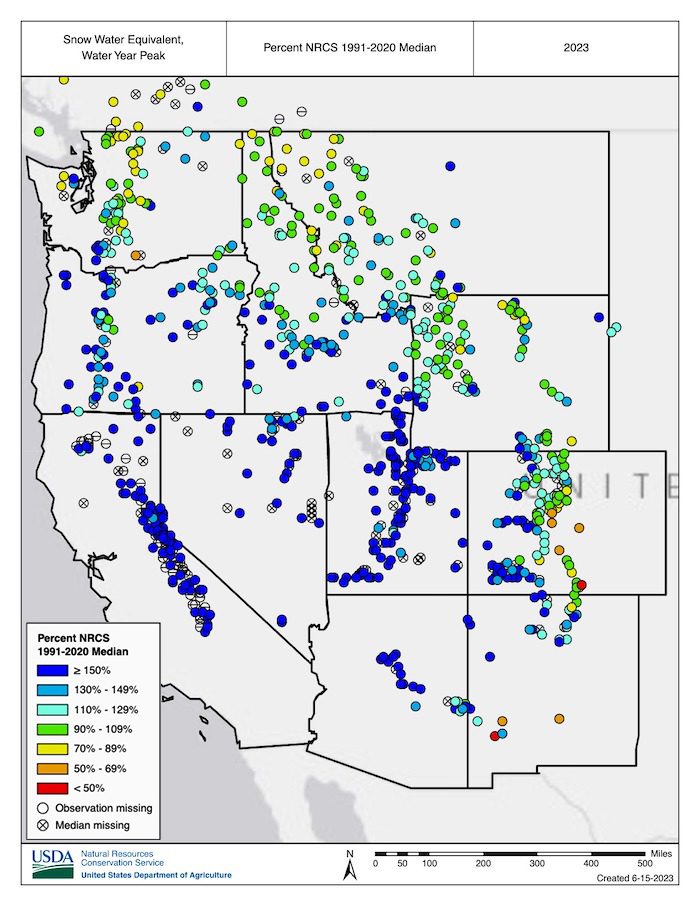
By the end of January, SNOTEL sites across much of the Sierra Nevada, Great Basin, Utah, Arizona, and western Colorado were at >150% of normal SWE. Unlike the 2021–2022 water year, in which snowfall was abundant early in winter but scarce after early January, the storm train continued with another series of strong storms across the West from late February through mid-March.

By April 1, snowpack was above normal across nearly the entire West, with few areas of snow drought. In some parts of the Sierra Nevada, Great Basin, Utah, Arizona, and western Colorado, SWE reached 200%–300% of normal and, in certain locations, set records. The northern Pacific Northwest and northwestern Montana was on the periphery of the storm track during most of winter. In these areas, snow drought developed as snowmelt began, and summer drought conditions are developing or seem likely to develop.

Key Points

  • An above-normal start to winter precipitation in the West—with the exception of the Pacific Northwest—accelerated when a series of 9 atmospheric rivers over a 3 week period brought significant amounts of rain and snow. The precipitation pattern this year was unlike that of last year, when the fire hose of storms shut off in January.
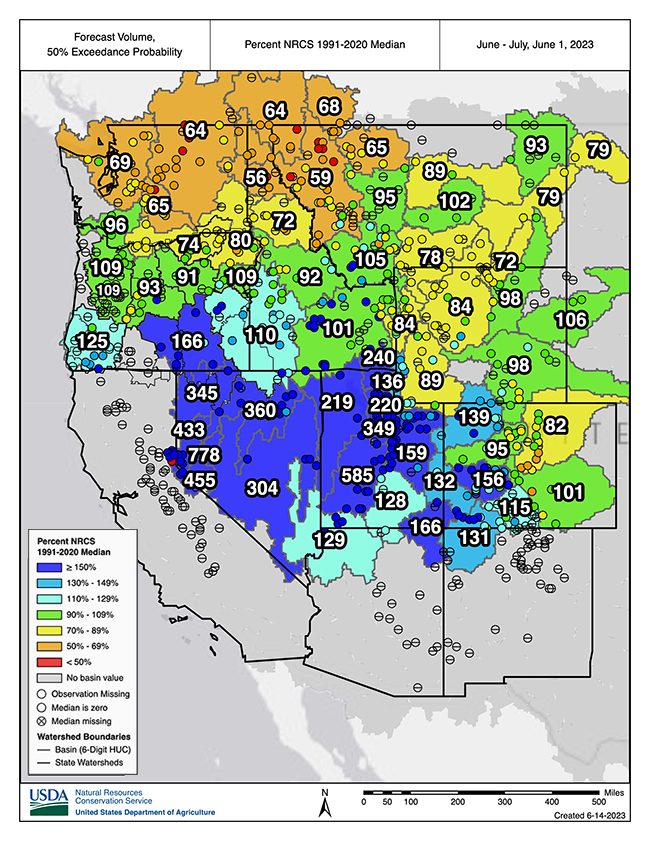
  • In the Sierra Nevada, Great Basin, and Colorado River Basin, the cool, wet, and snowy year brought major drought relief. As of mid-June, observed water year runoff has been above normal, and forecasts indicate that above-normal summer flows will persist.
  • Higher-elevation snowpack across the West remains, and is remarkably deep for mid-June in parts of the Sierra Nevada and southern Cascades.
  • Persistent and widespread anomalously cold winter temperatures, which have not occurred in recent years, aided snowpack development.
  • Lakes Powell and Mead, the two largest reservoirs in the country, have benefited this year, but it will take much more than one wet year to refill them after over 20 years of decreasing water levels.
  • Rapid snowmelt and early melt out have been problematic in parts of the Pacific Northwest. Abnormal dryness (D0) and moderate drought (D1) reappeared in Washington and Oregon over the past three weeks.
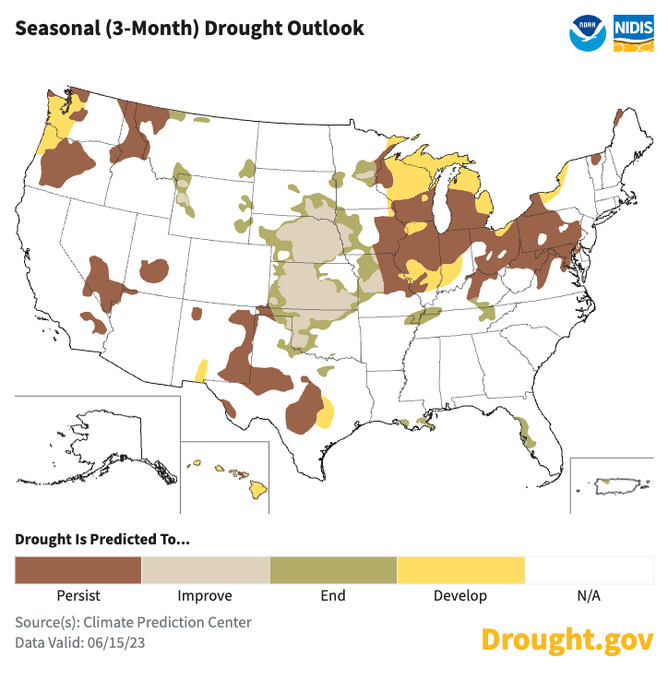
  • El Niño conditions have developed and are expected to gradually strengthen into winter. A stronger El Niño means global temperature, precipitation, and other patterns are more likely to reflect the expected El Niño impacts, such as wetter conditions in the southern U.S. and warmer conditions in the northern U.S. Historically, impacts from the transition to El Niño begin to be felt in early fall.

Abnormally cold temperatures persistent and widespread in winter 2022-23

During the past winter, unlike many recent years, anomalously cold temperatures were persistent and widespread. November through March temperatures were among the lowest third of all years since 1895 across much of the West. Temperatures in parts of California, Nevada, Oregon, and Idaho were among the coldest ten percent. Impacts of the cold temperatures included an unusual proportion of precipitation falling as snow compared to rain, snow persisting at lower elevations for longer than usual, and little mid-winter snow melt at higher elevations.

Drying and warming trend in April

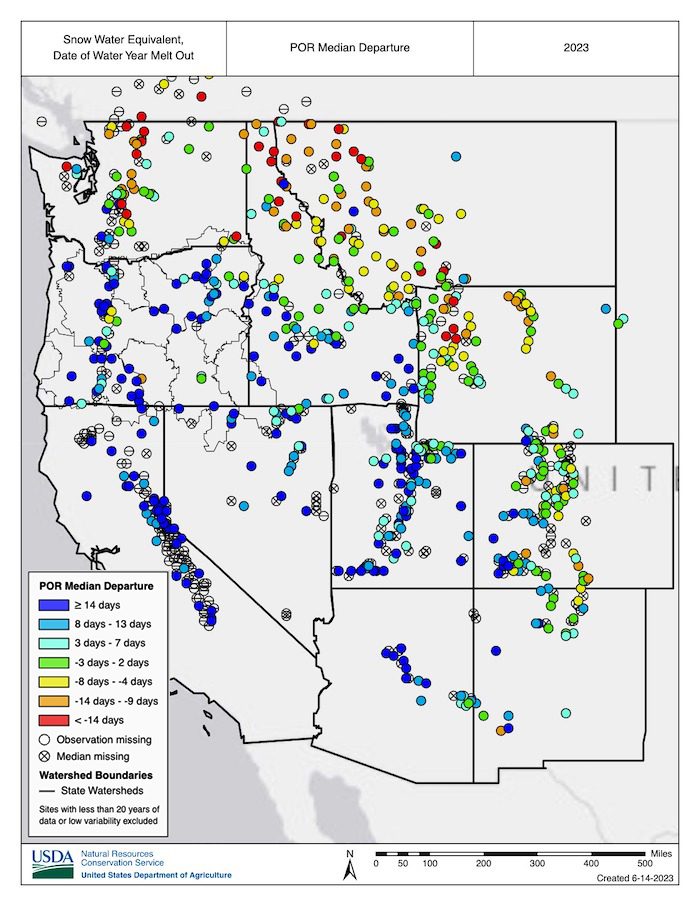
April brought a drying and warming trend to the Southwest and above-normal precipitation and cooler temperatures to Oregon and Washington, reducing some of the snowpack deficits in the Cascade Range. However, the cool and wet conditions in the Pacific Northwest were short-lived. Throughout May and into early June, temperatures across the Pacific Northwest and northern Rocky Mountains were above normal, with record warmth in parts of northern Oregon, Washington, northern Idaho, and northwestern Montana. The warm temperatures combined with relatively dry conditions have led to rapid snow loss across the region, and snow has melted one to three weeks early at many SNOTEL stations (70 sites in Oregon, Washington, Idaho, and Montana melted out more than a week early).

May snowmelt

May snowmelt reached record highs across many western regions, not just the Pacific Northwest. However, in terms of drought development, the early snowmelt was only problematic for parts of the Pacific Northwest and northern Rocky Mountains, where snowpack at the beginning of May was near normal or below normal (unlike the near-record snowpack in the Sierra Nevada, Utah, and western Colorado). The rapid snow loss, low winter precipitation, and forecasted below-normal summer runoff have renewed concerns about drought in the Pacific Northwest, with abnormal dryness (D0) and moderate drought (D1) reappearing in portions of western Washington and Oregon over the past three weeks.

Snowpack “remarkably deep” for mid-June

Currently, snowpack persists at higher elevations throughout the West and remains remarkably deep for mid-June in parts of the Sierra Nevada and southern Cascade Range. A few notable locations include Leavitt Lake in the central Sierra Nevada, with 92 inches of SWE remaining as of June 12; Lower Lassen Peak in the southern Cascade Range, with 82 inches of SWE remaining; and Mount Rose Ski Area near Lake Tahoe, with 43 inches of SWE remaining.

Drought relief in California and Colorado River Basin

For California, the Great Basin, and the Colorado River Basin, the cool, wet, and snowy year brought major drought relief after three consecutive dry years. Observed water year runoff in these regions was above normal through early June, and the forecasts indicate above-normal flows persisting throughout summer.

Lake Powell and Lake Mead

Major reservoirs, with the exception of Lakes Powell and Mead, have already filled or are expected to fill by the end of summer. This year was still beneficial for Lakes Powell and Mead, the two largest reservoirs in the country, but it will take much more than one wet year to refill these reservoirs after over 20 years of falling water levels. The June 12th update from the U.S. Bureau of Reclamation indicated that Lake Powell was at 37% of capacity and Lake Mead was at 31% of capacity, with forecasted April–July inflows into Powell at 167% of normal.

(Editor’s Note: NIDIS and its partners launched this snow drought effort in 2018 to provide data, maps, and tools for monitoring snow drought and its impacts as well as communicating the status of snow drought across the United States, including Alaska. Thank you to our partners for your continued support of this effort and review of these updates. For more information contact: Daniel McEvoy, Western Regional Climate Center, Amanda Sheffield, NOAA/NIDIS California-Nevada Regional Drought Information Coordinator, and Britt Parker, NOAA/NIDIS Pacific Northwest Regional Drought Information Coordinator: www.drought.gov/drought-status-updates/water-year-2023-snow-drought-conditions-summary-and-impacts-west-2023-06-15)

Here Comes El Niño: It’s Early, Likely to be Big, Sloppy and Add Even More Heat to a Warming World

An early bird El Niño has officially formed, likely to be strong, warp weather worldwide and give an already warming Earth an extra kick of natural heat, meteorologists announced.

The National Oceanic and Atmospheric Administration Thursday issued an El Niño advisory, announcing the arrival of the climatic condition. It may not quite be like the others.


Ahead of New Colorado River Talks, Governments and Tribes Weigh in On the Future

Hot on the heels of a short-term agreement to cut back on Colorado River water use, states are looking ahead to talks about more permanent cuts. The Bureau of Reclamation, the federal agency which manages the West’s water, announced that those negotiations will formally begin next week with a notice in the Federal Register.

The announcement came at an environmental law conference in Boulder, Colorado on Thursday, where scientists, state and federal governments, and tribes met at the University of Colorado’s law school.

Broken Record: Atmospheric Carbon Dioxide Levels Jump Again

Carbon dioxide levels measured at NOAA’s Mauna Loa Atmospheric Baseline Observatory peaked at 424 parts per million (ppm) in May, continuing a steady climb further into territory not seen for millions of years, scientists from NOAA and Scripps Institution of Oceanography at UC San Diego announced today, June 5, 2023.

CO2-Carbon Dioxide levels-Climate Change-Scripps Institution of Oceanography

Broken Record: Atmospheric Carbon Dioxide Levels Jump Again

Carbon dioxide levels measured at NOAA’s Mauna Loa Atmospheric Baseline Observatory peaked at 424 parts per million (ppm) in May, continuing a steady climb further into territory not seen for millions of years, scientists from NOAA and Scripps Institution of Oceanography at UC San Diego announced today.

Measurements of carbon dioxide (CO2) obtained by NOAA’s Global Monitoring Laboratory averaged 424 parts per million in May, the month when CO2 peaks in the Northern Hemisphere. That represents an increase of 3.0 ppm over May 2022. Scientists at Scripps Oceanography, which maintains an independent record, calculated a May monthly average of 423.78 ppm. That increase is also a jump of 3.0 ppm over the May 2022 average reported by the Scripps COProgram.

“Sadly we’re setting a new record,” said Scripps Oceanography geoscientist Ralph Keeling, who oversees the iconic Keeling Curve record established by his father 65 years ago. “What we’d like to see is the curve plateauing and even falling because carbon dioxide as high as 420 or 425 parts per million is not good. It shows as much as we’ve done to mitigate and reduce emissions, we still have a long way to go.”

Carbon dioxide levels

CO2 levels are now more than 50% higher than they were before the onset of the industrial era.

“Every year we see carbon dioxide levels in our atmosphere increase as a direct result of human activity,” said NOAA Administrator Rick Spinrad, Ph.D. “Every year, we see the impacts of climate change in the heat waves, droughts, flooding, wildfires and storms happening all around us. While we will have to adapt to the climate impacts we cannot avoid, we must expend every effort to slash carbon pollution and safeguard this planet and the life that calls it home.”

CO2 pollution is generated by burning fossil fuels for transportation and electrical generation, by cement manufacturing, deforestation, agriculture and many other practices. Like other greenhouse gases, COtraps heat radiating from the planet’s surface that would otherwise escape into space, amplifying extreme weather events, such as heat waves, drought and wildfires, as well as precipitation and flooding.

Rising CO2 levels also pose a threat to the world’s ocean, which absorbs both CO2 gas and excess heat from the atmosphere. Impacts include increasing surface and subsurface ocean temperatures and the disruption of marine ecosystems, rising sea levels and ocean acidification, which changes the chemistry of seawater, leading to lower dissolved oxygen, and interferes with the growth of some marine organisms.

This year, NOAA’s measurements were obtained from a temporary sampling site atop the nearby Mauna Kea volcano, which was established after lava flows cut off access to the Mauna Loa observatory in November 2022. Scripps’s May measurements were taken at Mauna Loa, after NOAA staff successfully repowered a Scripps instrument with a solar and battery system in March.

Climate Change

The Mauna Loa data, together with measurements from sampling stations around the world, are incorporated by NOAA’s Global Monitoring Laboratory into the Global Greenhouse Gas Reference Network, a foundational research dataset for international climate scientists and a benchmark for policymakers attempting to address the causes and impacts of climate change.

Widely considered the premier global sampling location for monitoring atmospheric CO2, NOAA and Scripps observatory operations were abruptly suspended on Nov. 29, 2022 when lava flows from the eruption of Mauna Loa volcano buried more than a mile of access road and destroyed transmission lines delivering power to the observatory campus. After a 10-day interruption, NOAA restarted greenhouse gas observations on Dec. 8 from a temporary instrument installation on the deck of the University of Hawaii observatory, located near the summit of Mauna Kea volcano. Scripps Oceanography initiated air sampling at Mauna Kea on Dec. 14, 2022 and resumed sampling at Mauna Loa on March 9, while maintaining their Mauna Kea observations.

Mauna Loa and Mauna Kea

Continuous daily samples were obtained from both Mauna Loa and Mauna Kea by Scripps Oceanography during May, the month when CO2 levels in the Northern Hemisphere reach their maximum levels for the year. Scripps recorded a May CO2  reading from Maunakea of 423.83, which is very close to the reading of 423.78 from Mauna Loa.

The Mauna Loa observatory is situated at an elevation of 11,141 feet above sea level, while the Mauna Kea sampling location is slightly higher, at an elevation of 13,600 feet. Scientists are able to sample air undisturbed by the influence of local pollution or vegetation, and produce measurements that represent the average state of the atmosphere in the Northern Hemisphere from both locations.

Scripps Oceanography geoscientist Charles David Keeling initiated on-site measurements of CO2 at NOAA’s Mauna Loa weather station in 1958. Keeling was the first to recognize that CO2 levels in the Northern Hemisphere fell during the growing season, and rose as plants died back in the fall. He documented these CO2 fluctuations in a record that came to be known as the Keeling Curve. He was also the first to recognize that, despite the seasonal fluctuation, CO2 levels rose every year.

NOAA began measurements in 1974, and the two research institutions have made complementary, independent observations ever since.

(Editor’s Note: The San Diego County Water Authority has partnered with the Scripps Institution of Oceanography at UC San Diego to better predict atmospheric rivers and improve water management before, during, and after those seasonal storms.) 

Experience a Sustainable Demonstration Garden Self-Tour

Sustainable landscape demonstration gardens inspire homeowners to create and maintain their own beautiful, water-efficient landscapes. In California, where more than half of urban water usage goes towards landscape irrigation, any reduction in water consumption contributes to successful conservation efforts.

The San Diego County Water Authority and several member agencies host demonstration gardens that residents can visit and gather ideas for their own landscape makeovers and water-efficient upgrades. With gardens flourishing in late spring, it’s the perfect time for a self-guided garden tour.