You are now in California and the West category.

(Left to right) California Dept. of Water Resources Director Karla Nemeth, California Natural Resources Agency Secretary Wade Crowfoot and Gov. Gavin Newsom join the snow survey team for fourth media snow survey of the 2024 season is held at Phillips Station in the Sierra Nevada. The survey is held approximately 90 miles east of Sacramento off Highway 50 in El Dorado County. Photo:  Andrew Nixon, California Dept. of Water Resources

Snow Survey Confirms Water Supplies Remain Plentiful for San Diego

The California Department of Water Resources performed its fourth snowpack survey of the season on Tuesday, April 2, confirming that the early winter’s “snow drought” gave way to a slightly above-normal snowpack following a series of storms.

DWR’s early April snow survey marks what is considered the peak snowpack for the year in the Sierra Nevada. The Colorado River Basin – San Diego County’s main source of water – also reports more snow than average for this time of year.

DWR’s survey recorded 64 inches of snow depth and a snow water equivalent of 27.5 inches, which is 113 percent of the average. The snow water equivalent measures the amount of water contained in the snowpack and is a key component of DWR’s water supply forecast.

Two consecutive wet winters, combined with regional investments and conservation by residents and businesses, delivered enough water to meet the San Diego region’s needs for the rest of 2024.

Wet Winter and Full Reservoirs Support Region

Across California, reservoirs are nearly full as we approach the start of summer—the heaviest water-use months. Plentiful water is a rare occurrence in the arid Southwest. From 2020 to 2022, the state suffered severe drought conditions that forced water-use reductions for millions of California residents.

California's major reservoirs are between 69 and 99 percent of capacity as of April 1. Graphic: California Dept. of Water Resources snow survey

California’s major reservoirs are between 69 and 99 percent of capacity as of April 1. Graphic: California Dept. of Water Resources

For the past decade, San Diego County has been insulated from drought-induced cutbacks due to the long-term investments in secure water supplies, a strategy that emerged in the early 1990s following an economically devastating drought. Since 1990, the region has dramatically cut water demands, reducing per capita water use by more than 50 percent. Water conservation has become a “way of life” for the region’s residents and businesses.

Innovative Leadership in Water Management

The Water Authority is currently working to sell or transfer some of its surplus water supply to areas with greater needs. For instance, an innovative water transfer deal could eventually deliver drought-resilient water supplies to South Orange County through the Moulton Niguel Water District and help combat increasing water rates for San Diegans.

A deal completed in late 2023 saved the San Diego region about $20 million. These water transfers help maintain the viability of the Colorado River as the most critical water resource for the Southwest.

“Wet years are the right time to prepare for the inevitable dry years,” said Water Authority General Manager Dan Denham. “That’s why we’re working every day to explore creative deals that help us reduce water rate pressures for San Diegans, enhance our long-term water security, and help our neighbors meet their needs for drought-resilient water supplies.”

(Editor’s Note: Information in this story was provided by the California Department of Water Resources).


Low-income-household water bills-federal assistance

Money Still Available for Low-Income Water Customers in San Diego County

Millions of dollars in federal aid are still available for low-income water customers in San Diego County to cover overdue residential water and wastewater bills. The San Diego County Water Authority helped secure the federal funds — and the deadline for applications has been extended to March 31, 2024.

The Low-Income Household Water Assistance Program (LIHWAP), established by Congress in 2021, offers one-time payments to cover outstanding residential water and/or wastewater bills. The federal government allocated $116 million to California to help households struggling to pay their water bills. Statewide, $40 million remains for the program, with nearly $5 million remaining for San Diego County.

“Water affordability is one of the top priorities for the Water Authority, and we are committed to helping ensure that everyone in San Diego County has access to safe and reliable water,” said Water Authority General Manager Dan Denham. “In addition to the current funds, the Water Authority is supporting efforts to develop federal legislation to make the low-income assistance program permanent.”

Financial aid for water customers

As part of its commitment to water affordability, the Water Authority partnered with the Metropolitan Area Advisory Committee on Anti-Poverty of San Diego County (MAAC) and Campesinos Unidos, Inc. to provide outreach and education so residents who are struggling economically are aware of the federal financial aid for water customers.

To find out if they are eligible and to participate in LIHWAP, customers must apply directly to MAAC or Campesinos, the local service providers selected by the state to implement the program in the San Diego region. LIHWAP will pay water-wastewater bills of up to $2,000. Qualified low-income households, including renters whose utility payments are included in their rent, are eligible for funds. Residents can determine their local service provider at www.csd.ca.gov/Pages/FindServicesInYourArea.aspx, by entering their city and locating their “water utility assistance provider.”

MAAC is a nonprofit that serves 75,000 individuals every year and partners with individuals and families to address their immediate needs and provide them with the tools and resources to achieve economic mobility. More information is at https://maacproject.org/lihwap/.

Campesinos was incorporated as a private non-profit corporation to specifically promote greater social, economic, educational, and employment training opportunities for farm workers and other economically disadvantaged residents of the Imperial, Riverside and San Diego counties. More information is at https://campesinosunidos.org/water-program/.

FIRO-Scripps-Law-Water Management

New California Law Taps Science to Improve Water Management

Legislation signed into law by California Governor Gavin Newsom ensures the state has the science and weather forecasting tools it needs for more flexible reservoir operations. The bill, AB 30, makes breakthrough water management technology standard for the California Department of Water Resources.

The legislation was introduced by San Diego Assemblymember Chris Ward and co-sponsored by the Sonoma County Water Agency and the San Diego County Water Authority. The bill was supported by the Water Authority’s partner, UC San Diego’s Scripps Institution of Oceanography.

Forecast-Informed Reservoir Operations strategy will help deal with drought and flood

The strategy is called forecast-informed reservoir operations, or FIRO, and it complements Gov. Newsom’s California Water Supply strategy released in August 2022 calling for more reservoir storage capacity to capture runoff from big storms, often fueled by atmospheric rivers. The governor and Legislature have already provided funding for state water managers to integrate the strategy.

“We thank Assemblymember Chris Ward for his leadership and vision in supporting next-gen water management and flood reduction efforts that will benefit residents statewide,” said Mel Katz, chair of the San Diego County Water Authority Board of Directors. “The legislation provides an innovative approach to help San Diego County and California thrive in the changing climate.”

Forecast-informed reservoir operations use weather predictions to advise dam operators about how much water to retain or release from reservoirs, enhancing their ability to handle whatever nature serves up while retaining as much water as possible in storage.

FIRO-Science-water management

Diagram illustrating the FIRO process to develop an adaptive water control manual. Graphic courtesy Scripps Institution of Oceanography Center for Western Weather and Water Extremes

Many reservoirs in the West are strictly regulated based on historical averages of winter storms and spring runoff. Under existing rules, the highly variable rainfall from year to year is not directly considered. Complicating the problem, many current guidelines and practices were developed before satellites, radar and advanced numerical models significantly improved weather forecasts.

To address these challenges, researchers at Scripps Institution of Oceanography and elsewhere developed tools that provide weather forecasters with reliable notice of atmospheric rivers a week in advance. Advancing this research could have taken decades, but sophisticated prediction products have evolved in less than 10 years with funding by the San Diego County Water Authority and other water agencies statewide, along with state and federal support.

The Water Authority has partnered with SIO and the Scripps Center for Western Weather and Water Extremes at UC San Diego, to share and support best practices in FIRO, to increase research around atmospheric rivers and droughts, and develop strategies for mitigating flood risk and increasing water supply reliability.

wine growing season-UCSD-Scripps-Napa Valley

Warming is Shifting Napa’s Wine Growing Season

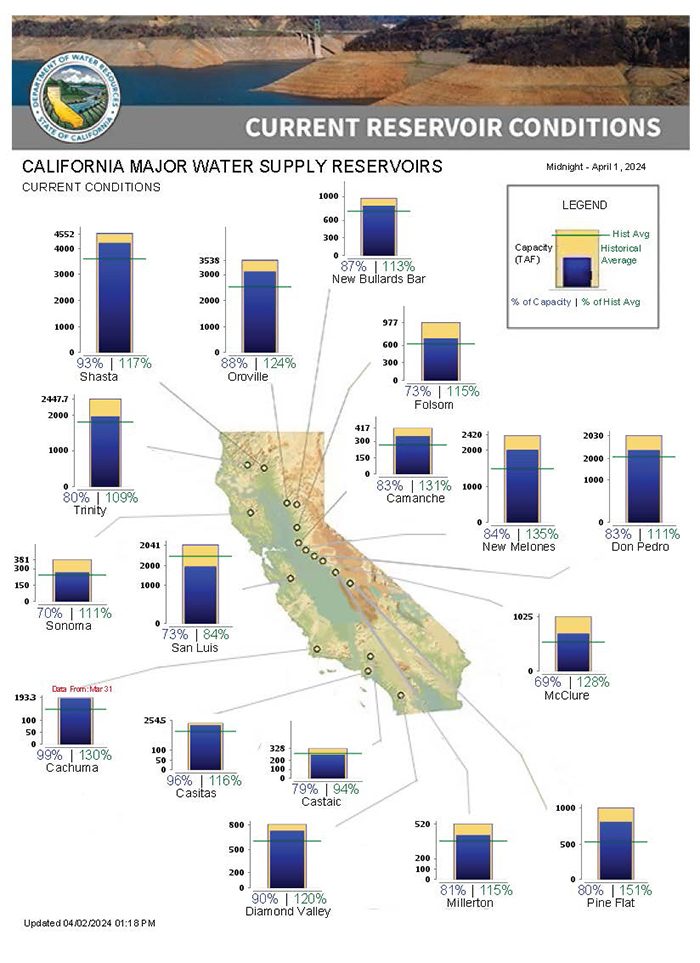
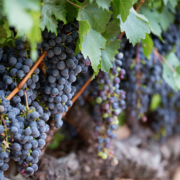
The start of wine grape growing season in California’s Napa Valley now comes nearly a month earlier than it used to because of the region’s warming climate, according to a new study from a team led by UC San Diego Scripps Institution of Oceanography researcher Dan Cayan.

The research, published online in the International Journal of Climatology on June 29, is based on an analysis of local temperature records spanning 1958-2016 that charts the effects of natural climate variations such as the Pacific Decadal Oscillation and the growing influence of human-caused climate change upon the seasonal rhythms and shorter term temperature extremes in Napa Valley.

Since 2006, Cayan has been working with the Napa Valley Vintners trade association, which funded the new research along with additional support from the National Oceanic and Atmospheric Administration (NOAA) and the U.S. Geological Survey (USGS), to help Napa vintners understand the effects of climate variation and change on their region and on their renowned premium grapevines.

“The vintners want to know what’s changing and what the nature of those changes is,” said Cayan.

In a 2011 report, Cayan showed that Napa had warmed by 1-2 degrees Fahrenheit since the 1930s — markedly less than the 3 degrees of warming suggested by earlier studies. Cayan and his team found then that the magnitude of warming in Napa is difficult to pin down exactly, and different temperature records and ways of treating them result in a substantial range in estimated temperature trends. The team took great pains to identify temperature records that most correctly captured Napa’s unique climate, which is affected both by cooler maritime influences and inland heat.

Temperature variation and change

The present study takes another look at Napa’s temperature variation and change, adding seven years of more recent data. It also takes a sharper aim at factors that are particularly important to Napa’s viticulture, translating the decades of temperature observations into a set of key wine-growing metrics. The goal, said Cayan, was to use this lengthy temperature record to examine the implications of the last six decades of temperature variation and change for Napa Valley vineyard growers and wine producers.

The researchers assembled their temperature data largely from observations taken at the Napa State Hospital. Cayan said the hospital’s location makes it an imperfect representation of weather conditions in Napa. It is close to roads and buildings which can influence temperature readings, but this weather station has been in place for several decades and biases introduced by the surroundings have likely been consistent. NOAA has also deemed the temperature record from the hospital reliable enough to use it as one the data sources for its national and regional scale climate monitoring in the United States.

The researchers filled in any missing data using other sources, such as the weather records from a weather station in Oakville, California managed by the state’s Department of Water Resources, and performed other quality control steps to ensure the data were as reliable as possible.

“Wine grapes offer a super interesting lens through which we can view climate variation,” said Cayan, noting the many ways temperature impacts grape growth and wine quality.

Using the Napa daily temperature records, the team developed and analyzed variations and changes in several temperature-dependent metrics of importance to wine grapes. Key among these metrics was the beginning of the growing season, which was defined as the time when the average daily temperature rises in spring to consistently exceed 50 degrees Fahrenheit.

The study also looked at the time required to bring wine grapes to maturity. Other measures included the occurrence of extreme hot days that may be detrimental to grape quality, and the temperature during the final 45 days before grapes mature — a period that is vital in determining grapes’ sugar content and flavor.

Growing season starts four weeks earlier now than in 1950s

The study found that the growing season now starts more than four weeks earlier than it did in 1958. This means that in Napa back around 1958, average daily temperatures typically first exceeded 50 degrees Fahrenheit consistently around April 1. Fast forwarding to 2016, the study finds that the start of the growing season generally occurs around March 1.

For wine growers and makers this means that wine grapes will also generally mature about a month earlier than they used to in the late 1950s, but Cayan noted that the actual harvest date is more changeable, as some vintners may make stylistic choices to delay harvest.

“This is a remarkable long-term shift given that wine grapes require about six months to mature on the vine and most year-to-year fluctuations in growing season start were typically limited to about three weeks,” said Cayan.

Warmer conditions, earlier growing seasons

The average temperature of the last 45 days of the growing season also warmed by more than 3 degrees Fahrenheit during the study period.

“The Napa record indicates an undeniable shift towards earlier growing seasons and warmer conditions,” said Cayan. “The strongest changes took hold in the 1970s and warmed pretty dramatically through the 1990s, in sync with the large-scale North Pacific climate shift that commenced in the mid-1970s.”

The warming trend Cayan and his colleagues observed in Napa echoed changes seen elsewhere in the American West and Pacific Ocean. In recent decades, western North America has been one of the U.S. hot spots for warming, with about 2 degrees Fahrenheit of increase compared to 1950’s temperatures. Napa’s warming during that period was roughly equivalent.

Anthropogenic climate change

Additionally, anomalously warm temperatures persisted in recent decades despite the fact that a natural source of climatic variation called the Pacific Decadal Oscillation reverted to its cooler state.

“As numerous studies have demonstrated in other settings, these persistent changes strongly suggest that anthropogenic climate change is playing a role,” said Cayan.

Along with warmer seasonal average temperatures in recent decades, the Napa record has shown a significant reduction in the occurrence of cool extremes and an increased occurrence of warm extremes.

Global impacts of climate change

The advancing start of the wine grape growing season in Napa joins a body of research documenting how climate change has altered seasons across the globe, with the most direct comparison being the earlier start of spring.

“This is another piece of evidence of a remarkable seasonal change occurring across the western landscape and is very likely a signal that is being reinforced by climate change,” said Cayan.

However, Cayan was careful to note that the links between Napa’s warming climate and anthropogenic climate change inferred in this study’s results were correlational rather than causal.

“Regional temperature changes including those in Napa Valley are invariably affected by multiple natural drivers as well as human-caused warming effects,” said Cayan. “Teasing those influences apart would require an extensive climate modeling attribution science study that was beyond the scope of the present study.”

Climate challenges for Napa Valley wine growers

For winemakers in Napa banking on the continuation of their historically mild Mediterranean climate, Cayan said the results underscore that “climate changes are likely to drive Napa growers to continue to innovate, perhaps using novel growing practices, and perhaps by introducing grape varieties that might be more heat-tolerant.”

Further, the paper states that the continued anomalous warmth of the last seven years combined with projected further warming strongly suggests that an additional 1 degree Fahrenheit of warming is likely within the next three decades, along with more significant and more frequent bouts of extreme heat.

“Such an increase in heat would impose a challenge in producing premium quality wine,” wrote the study authors.

Rapidly warming climate

And Napa is not alone. Other regions with longer wine growing traditions, such as France or Italy, are already experiencing similar forks in the road when it comes to the continued viability of their chosen varieties and systems of agriculture in the face of rapidly warming climate.

Looking forward, Cayan suggested that California should take an even more fine-grained approach to anticipate the local effects of climate change, especially in regions with sensitive crops such as wine.

“A key issue for Napa is the extent to which its climate will be moderated by its marine layer air-conditioning and whether that can overcome the faster warming projected in nearby inland regions,” said Cayan. “We need more precise regional climate investigations to get a better handle on how changes in the coast-interior transition zones might unfold.”

Laurel DeHaan and Mary Tyree of Scripps Oceanography as well as sustainability scientist Kimberly Nicholas of Lund University were co-authors of the study.

(Editor’s Note: Story by Alex Fox, at UC San Diego Scripps Institution of Oceanography. The San Diego County Water Authority has partnered with the Scripps Institution of Oceanography at UC San Diego to better predict atmospheric rivers and improve water management before, during, and after those seasonal storms.)

snowmelt runoff-streamflow-records

Snowmelt Runoff Sets Streamflow Records in the Southwest

Across the western U.S., many areas received record or near-record amounts of snowpack over the winter. With the spring and summer temperatures melting the abundant snow, a record volume of streamflow has been recorded in several basins in the southwestern U.S., providing more water for the area later into the summer than is typically seen.

Snowmelt runoff in Walker and Carson basins

The Walker and Carson basins near the California-Nevada border, for example, have reported the largest volume of streamflow for April through July that has ever been observed in roughly a century, when the records began. The ample runoff is helping fill reservoirs that have been depleted from years of drought conditions.

Weekly U.S. Drought Monitor: Cooler Northwest, Warmer Southwest

Dry conditions dominated the West and southern Plains, coupled with above-normal temperatures. Precipitation was most widespread throughout much of the upper Midwest and central Plains and into the Northeast. Almost the entire country had near- to above-normal temperatures this last week, with the greatest departures over the Southwest and central Plains where temperatures were at least 4-7 degrees above normal.

Cooler-than-normal temperatures were recorded in the Pacific Northwest with departures of 3-6 degrees below normal. At the end of the current U.S. Drought Monitor period, significant rains developed over portions of the Midwest and central Plains, and they will be accounted for in the next analysis.

U.S. Seasonal Drought Outlook

Central portions of the Intermountain West may be spared degradation, as those areas are still showing residual benefits from above normal winter snowpack leading up to the summer, in addition to periods of above normal rainfall during the last 60 to 90 days. Seasonal temperature and precipitation outlooks, ENSO, and climatology favor widespread drought improvement and removal across the central U.S. However, drought persistence is favored across the Upper Midwest, although there is the potential for localized improvements.” Read full assessment: cpc.ncep.noaa.gov/products/expert_assessment/sdo_summary.php.

Seasonal Precipitation Outlook: November, December, January 2023-24

Colors show where total precipitation has an increased chance of being higher or lower than usual during the next three months. The darker the shading, the greater the chance for the indicated condition. White areas have equal chances for precipitation totals that are below, near, or above the long-term average (median) for the next three months.

Climate scientists base future climate outlooks on current patterns in the ocean and atmosphere. They examine projections from climate and weather models and consider recent trends. They also check historical records to see how much precipitation fell when patterns were similar in the past.

Copernicus Climate Change Service: July 2023 sees multiple global temperature records broken

July 2023 highlights:

  • The global average temperature for July 2023 is confirmed to be the highest on record for any month.
  • Antarctic sea ice extent continued to break records for the time of year, with a monthly value 15% below average, by far the lowest July extent since satellite observations began.
  • July 2023 was wetter than average over most of northern Europe and in a region from the Black Sea and Ukraine to northwestern Russia. Drier than average conditions were experienced across the Mediterranean basin, with Italy and southeastern Europe having the largest anomalies.

July 2023 NOAA State of Climate Report

Record-high temps & devastating floods struck the U.S. 15 separate billion-dollar disasters occurred during the 1st 7 months of 2023. More from NOAA’s July State of Climate report.

(Editor’s Note: Content for this story comes from the Natural Resources Conservation Service, which produces a weekly report using data and products from the National Water and Climate Center and other agencies. The report focuses on seasonal snowpack, precipitation, temperature, and drought conditions in the United States.)

winter waves-Climate Change-Sea Level Rise-UCSD-Scripps Institution of Oceanography research

California’s Winter Waves May Be Increasing Under Climate Change

A new study from UC San Diego Scripps Institution of Oceanography researcher emeritus Peter Bromirski uses nearly a century of data to show that the average heights of winter waves along the California coast have increased as climate change has heated up the planet.

The study, published August 1 in the Journal of Geophysical Research – Oceans, achieved its extraordinarily long time series by using seismic records dating back to 1931 to infer wave height, a unique but accepted method first developed by Bromirski in 1999. The results, made more robust by their 90 years of statistical power, join a growing body of research that suggests storm activity in the North Pacific Ocean has increased under climate change.

If global warming accelerates, growing winter wave heights could have significant implications for flooding and erosion along California’s coast, which is already threatened by accelerating sea-level rise.

When waves reach shallow coastal waters, some of their energy is reflected back out to sea, Bromirski said. When this reflected wave energy collides with waves approaching the shoreline, their interaction creates a downward pressure signal that is converted into seismic energy at the seafloor. This seismic energy travels inland in the form of seismic waves that can be detected by seismographs. The strength of this seismic signal is directly related to wave height, which allowed him to calculate one from the other.

Calculating water heights

In using this relationship to infer wave height, Bromirski had to filter out the “noise” of actual earthquakes, which he said is easier than it sounds because earthquakes are typically much shorter in duration than the ocean waves caused by storms.

Bromirski developed this novel way to calculate wave heights out of necessity. Seeing patterns or trends in phenomena such as storm activity or big wave events associated with climate change requires many decades of data, and the buoys that directly measure wave heights along the California coast have only been collecting data since around 1980. Of particular interest to Bromirski were the decades prior to 1970 when global warming began a significant acceleration. If he could get his hands on wave records stretching back several decades before 1970, then he could assess the potential influence of climate change.

Since no direct wave measurements going back that far existed, Bromirski began a search for alternative sources of data in the 1990s. In 1999, he published a paper detailing his method of deriving historic wave heights using modern digital seismic records. In the process, Bromirski learned that UC Berkeley had seismic records going back nearly 70 years at the time. The problem was that these records were all analog — just sheets and sheets of paper covered in the jagged lines of seismograph readings.

To work in the many decades of seismic records held at UC Berkeley to create a long-term wave record using this method, Bromirski needed to digitize the reams of analog seismograms spanning 1931 to 1992 so that he could analyze the dataset as a whole. The process required the enthusiasm of multiple undergraduate students, a special flatbed scanner, and multiple years of intermittent effort to complete.

Finally, with the digitized seismic data spanning 1931-2021 in hand, Bromirski was able to transform those data into wave heights and begin to look for patterns.

Average winter wave height increased 13% since 1970

The analysis revealed that in the era beginning after 1970, California’s average winter wave height has increased by 13% or about 0.3 meters (one foot) compared to average winter wave height between 1931 and 1969. Bromirski also found that between 1996 and 2016 there were about twice as many storm events that produced waves greater than four meters (13 feet) in height along the California coast compared to the two decades spanning 1949 to 1969.

“After 1970, there is a consistently higher rate of large wave events,” said Bromirski. “It’s not uncommon to have a winter with high wave activity, but those winters occurred less frequently prior to 1970. Now, there are few winters with particularly low wave activity. And the fact that this change coincides with the acceleration of global warming near 1970 is consistent with increased storm activity over the North Pacific resulting from climate change.”

Bigger winter waves and sea-level rise

The results echo an increase in wave height in the North Atlantic tied to global warming reported by a 2000 study.

If California’s average winter waves continue to get bigger under climate change, it could amplify the effects of sea-level rise and have significant coastal impacts.

“Waves ride on top of the sea level, which is rising due to climate change,” said Bromirski. “When sea levels are elevated even further during storms, more wave energy can potentially reach vulnerable sea cliffs, flood low-lying regions, or damage coastal infrastructure.”

To see how his results compared with atmospheric patterns over the North Pacific, which typically supplies the California coast with its winter storms and waves, Bromirski looked to see if a semi-permanent wintertime low pressure system located near Alaska’s Aleutian Islands called the Aleutian Low had intensified in the modern era. A more pronounced Aleutian Low typically corresponds to increased storm activity and intensity.

Coastal impacts in California

Per the study, the intensity of the Aleutian Low has generally increased since 1970. “That intensification is a good confirmation that what we are seeing in the wave record derived from seismic data is consistent with increased storm activity,” said Bromirski. “If Pacific storms and the waves they produce keep intensifying as climate change progresses and sea-level rises, it creates a new dimension that needs to be considered in terms of trying to anticipate coastal impacts in California.”

(Editor’s Note: Story by Alex Fox, at UC San Diego Scripps Institution of Oceanography. The San Diego County Water Authority has partnered with the Scripps Institution of Oceanography at UC San Diego to better predict atmospheric rivers and improve water management before, during, and after those seasonal storms.)

national study-research-water assets

National Study Aims to Assist Water Utilities

A University of Texas at Arlington civil engineering researcher is leading a nationwide study to find and assess innovative technologies for monitoring water assets.

Mo Najafi
Mohammad Najafi

Mohammad Najafi, associate professor of civil engineering, is using a $410,000 grant from the Water Research Foundation for the project.

“We hope to streamline water asset monitoring so water utilities can make timely decisions and optimize their maintenance activities,” Najafi said. “We will investigate the utilization of existing and innovative asset-monitoring technologies—such as drones, sensors, fiber optics and more—for both horizontal and vertical assets. Considerations for both large and small water utilities will be given.”

Water Authority participates in national study

The San Diego County Water Authority is among water agencies involved in the project.

“We are happy to collaborate with the University of Texas at Arlington and the water utilities that have come together on this project,” said Martin Coghill, operations and maintenance manager with the San Diego County Water Authority. “It’s an exciting time to be in the water industry with new technologies being developed to help manage water assets more efficiently and effectively. Sharing our experiences and learning from others’ experiences has a huge value for us, our regional partners, and the industry as a whole.”

scanny-national study-innovation-technology-San Diego County Water Authority

In 2022, the San Diego County Water Authority was granted its first utility patent for a device that inspects interior sections of water pipelines that are inaccessible or not safe to inspect without expensive specialized gear and training. Inventor Martin Coghill calls the tool “scanny.” Photo: San Diego County Water Authority

Other water entities involved in the project include DC Water, Los Angeles County Sanitation Districts, CDM Smith, Dallas Water Utilities, Greater Cincinnati Water Works, Dallas County, Tarrant Regional Water District, WaterOne, American Water, WSSC Water, Great Lakes Water Authority, Orange County Utilities and Underground Infrastructure.

Vinayak Kaushal, assistant professor of civil engineering, will serve as co-principal investigator. Zahra Borhani, program manager at the Center for Underground Infrastructure Research and Education (CUIRE), and Diego Calderon, a doctoral candidate, are part of the UT Arlington team for this project. Najafi leads CUIRE, a research, education and outreach organization that is part of UT Arlington’s Department of Civil Engineering. Since its inception, it has focused on assembling exceptional and broad-reaching engineering and technical talent to address the needs of underground infrastructure on regional, state, national and international scales.

Water infrastructure part of national study

The project will perform a comprehensive literature review on the topic, hold conferences and webinars among water utilities and industry leaders, provide case studies of what is available and make recommendations and guidelines on what to use in the future. Najafi will look at above-ground water infrastructure like reservoirs and dams, as well as below-ground infrastructure like pipes and mains.

Najafi said the project will identify gaps in water utility monitoring and make recommendations to fill them.

“Water monitoring now consists of using sensors, drones, fiber optics and advanced metering infrastructure. Other technologies are on the market and currently being used, but not by everyone,” he said. “We hope to issue a best practices guideline for water entities.”

Melanie Sattler, chair of the Department of Civil Engineering, said Najafi’s project will give water entities better information now and in the future.

“Water monitoring is essential to providing the resources needed for life and growth. This project does just that,” Sattler said. “Knowing how much water you have is vital to planning for the future.”

June 2023-Climate Change-Record Heat-Air Quqlity

June Marked by Record U.S. Heat Waves, Severe Weather

June 2023 was record hot for some parts of the U.S., while other locations were roiled by severe weather and poor air quality, according to NOAA’s National Centers for Environmental Information. Heat waves led to record high temperatures in Puerto Rico, the Northeast, Mid-Atlantic, Great Lakes, Texas, and Louisiana.

Thick smoke from Canadian wildfires created air quality issues for millions of people in portions of the Northeast and Great Lakes this June. On June 7, around 100 million people across 16 states were under air quality alerts while New York City reported the worst air quality of major cities worldwide. According to the July 4 U.S. Drought Monitor report, about 27.0% of the contiguous U.S. was in drought, up about 8.0% from the end of May. Most of the drought expansion took place in the Midwest, Texas, and the South.

Highlights from “Assessing the U.S. Climate in June 2023” from NOAA National Centers for Environmental Information

  • Heat waves impacted the southern Plains, Northeast and Puerto Rico this month, breaking temperature records and creating life-threatening conditions.
  • In June, the average temperature and precipitation for the contiguous U.S. ranked in the middle third of the historical record.
  • A total of 12 billion-dollar weather and climate disasters have been confirmed this year. These disasters consisted of 10 severe storm events, one winter storm and one flooding event.
  • Thick smoke from Canadian wildfires created air quality issues for millions in portions of the Northeast and Great Lakes this June.
  • Portions of the Midwest experienced dry soils, low streamflows and distressed crops in June. Missouri, Illinois, Wisconsin and Michigan each ranked in the top-10 driest June on record.


Temperature – ‘Record Hot’

The average temperature of the contiguous U.S. in June was 69.0°F, 0.5°F above average, ranking in the middle third of the 129-year record. Generally, June temperatures were below average from California to the central Plains and across much of the Mid-Atlantic and Southeast.

Temperatures were above average from the Northwest to the northern Plains, as well as in the southern Plains and Florida Peninsula. North Dakota ranked third warmest on record for June while two additional states ranked among their top-10 warmest on record. Conversely, West Virginia and Virginia had their ninth- and 10th-coldest June on record, respectively.

The Alaska statewide June temperature was 50.0°F, 0.8°F above the long-term average, ranking in the middle third of the 99-year period of record for the state. Above-normal temperatures were observed across the Aleutians and in parts of the North Slope and the Southeast during the month while small pockets of below-average temperatures were observed in interior portions of the state.

Precipitation

June precipitation for the contiguous U.S. was 2.85 inches, 0.08 inch below average, ranking in the middle third of the historical record. Precipitation was above average across much of the West and in parts of the Southeast and New England.

Precipitation was below average across much of the Midwest and in parts of the Northwest, Southwest, southern Plains, Mid-Atlantic and southern New England. Wisconsin and Michigan each had their fifth-driest June on record, while two additional states had their top-10 driest June on record. Conversely, Wyoming ranked third wettest with two additional states ranking among their top-10 wettest June on record.

Across the state of Alaska, the average monthly precipitation was 2.85 inches, making last month the 19th-wettest June in the 99-year record. Conditions were wetter than average across most of the state while parts of the Northeast, Southwest and Panhandle were near normal and parts of the Southeast Interior and Aleutians observed below-normal precipitation during the month.

Billion-Dollar Disasters

Three new billion-dollar weather and climate disasters were confirmed this month, two of which occurred during the month of May. All of these disasters were severe storm events.

For 2023 to-date, 12 weather and climate disasters have losses exceeding $1 billion. These disasters consisted of 10 severe storm events, one winter storm and one flooding event. The total cost of these events exceeds $32.7 billion (CPI-adjusted), and they have resulted in 100 direct and indirect fatalities. For this year-to-date period, the first six months of 2023 rank second-highest for disaster count, behind 2017 with 14 disasters and behind 2021 which had $42.5 billion in terms of total cost.

drought relief-snowpack-West-NIDIS winter update

This Year’s Snow Season Wipes Away Drought in Much of the West

The 2022–2023 snow season started off relatively active across the West, with a few modest storms bringing snow accumulations to the mountains in early November.

By the start of December, snow water equivalent (SWE) across much of the region was above normal. Starting in early December, several storm cycles brought moisture-laden families of atmospheric rivers to the West Coast. Most of the landfalls occurred in California. The strongest series of storms occurred steadily from December 27 through January 17.

By the end of January, SNOTEL sites across much of the Sierra Nevada, Great Basin, Utah, Arizona, and western Colorado were at >150% of normal SWE. Unlike the 2021–2022 water year, in which snowfall was abundant early in winter but scarce after early January, the storm train continued with another series of strong storms across the West from late February through mid-March.

By April 1, snowpack was above normal across nearly the entire West, with few areas of snow drought. In some parts of the Sierra Nevada, Great Basin, Utah, Arizona, and western Colorado, SWE reached 200%–300% of normal and, in certain locations, set records. The northern Pacific Northwest and northwestern Montana was on the periphery of the storm track during most of winter. In these areas, snow drought developed as snowmelt began, and summer drought conditions are developing or seem likely to develop.

Key Points

  • An above-normal start to winter precipitation in the West—with the exception of the Pacific Northwest—accelerated when a series of 9 atmospheric rivers over a 3 week period brought significant amounts of rain and snow. The precipitation pattern this year was unlike that of last year, when the fire hose of storms shut off in January.
  • In the Sierra Nevada, Great Basin, and Colorado River Basin, the cool, wet, and snowy year brought major drought relief. As of mid-June, observed water year runoff has been above normal, and forecasts indicate that above-normal summer flows will persist.
  • Higher-elevation snowpack across the West remains, and is remarkably deep for mid-June in parts of the Sierra Nevada and southern Cascades.
  • Persistent and widespread anomalously cold winter temperatures, which have not occurred in recent years, aided snowpack development.
  • Lakes Powell and Mead, the two largest reservoirs in the country, have benefited this year, but it will take much more than one wet year to refill them after over 20 years of decreasing water levels.
  • Rapid snowmelt and early melt out have been problematic in parts of the Pacific Northwest. Abnormal dryness (D0) and moderate drought (D1) reappeared in Washington and Oregon over the past three weeks.
  • El Niño conditions have developed and are expected to gradually strengthen into winter. A stronger El Niño means global temperature, precipitation, and other patterns are more likely to reflect the expected El Niño impacts, such as wetter conditions in the southern U.S. and warmer conditions in the northern U.S. Historically, impacts from the transition to El Niño begin to be felt in early fall.

Abnormally cold temperatures persistent and widespread in winter 2022-23

During the past winter, unlike many recent years, anomalously cold temperatures were persistent and widespread. November through March temperatures were among the lowest third of all years since 1895 across much of the West. Temperatures in parts of California, Nevada, Oregon, and Idaho were among the coldest ten percent. Impacts of the cold temperatures included an unusual proportion of precipitation falling as snow compared to rain, snow persisting at lower elevations for longer than usual, and little mid-winter snow melt at higher elevations.

Drying and warming trend in April

April brought a drying and warming trend to the Southwest and above-normal precipitation and cooler temperatures to Oregon and Washington, reducing some of the snowpack deficits in the Cascade Range. However, the cool and wet conditions in the Pacific Northwest were short-lived. Throughout May and into early June, temperatures across the Pacific Northwest and northern Rocky Mountains were above normal, with record warmth in parts of northern Oregon, Washington, northern Idaho, and northwestern Montana. The warm temperatures combined with relatively dry conditions have led to rapid snow loss across the region, and snow has melted one to three weeks early at many SNOTEL stations (70 sites in Oregon, Washington, Idaho, and Montana melted out more than a week early).

May snowmelt

May snowmelt reached record highs across many western regions, not just the Pacific Northwest. However, in terms of drought development, the early snowmelt was only problematic for parts of the Pacific Northwest and northern Rocky Mountains, where snowpack at the beginning of May was near normal or below normal (unlike the near-record snowpack in the Sierra Nevada, Utah, and western Colorado). The rapid snow loss, low winter precipitation, and forecasted below-normal summer runoff have renewed concerns about drought in the Pacific Northwest, with abnormal dryness (D0) and moderate drought (D1) reappearing in portions of western Washington and Oregon over the past three weeks.

Snowpack “remarkably deep” for mid-June

Currently, snowpack persists at higher elevations throughout the West and remains remarkably deep for mid-June in parts of the Sierra Nevada and southern Cascade Range. A few notable locations include Leavitt Lake in the central Sierra Nevada, with 92 inches of SWE remaining as of June 12; Lower Lassen Peak in the southern Cascade Range, with 82 inches of SWE remaining; and Mount Rose Ski Area near Lake Tahoe, with 43 inches of SWE remaining.

Drought relief in California and Colorado River Basin

For California, the Great Basin, and the Colorado River Basin, the cool, wet, and snowy year brought major drought relief after three consecutive dry years. Observed water year runoff in these regions was above normal through early June, and the forecasts indicate above-normal flows persisting throughout summer.

Lake Powell and Lake Mead

Major reservoirs, with the exception of Lakes Powell and Mead, have already filled or are expected to fill by the end of summer. This year was still beneficial for Lakes Powell and Mead, the two largest reservoirs in the country, but it will take much more than one wet year to refill these reservoirs after over 20 years of falling water levels. The June 12th update from the U.S. Bureau of Reclamation indicated that Lake Powell was at 37% of capacity and Lake Mead was at 31% of capacity, with forecasted April–July inflows into Powell at 167% of normal.

(Editor’s Note: NIDIS and its partners launched this snow drought effort in 2018 to provide data, maps, and tools for monitoring snow drought and its impacts as well as communicating the status of snow drought across the United States, including Alaska. Thank you to our partners for your continued support of this effort and review of these updates. For more information contact: Daniel McEvoy, Western Regional Climate Center, Amanda Sheffield, NOAA/NIDIS California-Nevada Regional Drought Information Coordinator, and Britt Parker, NOAA/NIDIS Pacific Northwest Regional Drought Information Coordinator: www.drought.gov/drought-status-updates/water-year-2023-snow-drought-conditions-summary-and-impacts-west-2023-06-15)

CO2-Carbon Dioxide levels-Climate Change-Scripps Institution of Oceanography

Broken Record: Atmospheric Carbon Dioxide Levels Jump Again

Carbon dioxide levels measured at NOAA’s Mauna Loa Atmospheric Baseline Observatory peaked at 424 parts per million (ppm) in May, continuing a steady climb further into territory not seen for millions of years, scientists from NOAA and Scripps Institution of Oceanography at UC San Diego announced today.

Measurements of carbon dioxide (CO2) obtained by NOAA’s Global Monitoring Laboratory averaged 424 parts per million in May, the month when CO2 peaks in the Northern Hemisphere. That represents an increase of 3.0 ppm over May 2022. Scientists at Scripps Oceanography, which maintains an independent record, calculated a May monthly average of 423.78 ppm. That increase is also a jump of 3.0 ppm over the May 2022 average reported by the Scripps COProgram.

“Sadly we’re setting a new record,” said Scripps Oceanography geoscientist Ralph Keeling, who oversees the iconic Keeling Curve record established by his father 65 years ago. “What we’d like to see is the curve plateauing and even falling because carbon dioxide as high as 420 or 425 parts per million is not good. It shows as much as we’ve done to mitigate and reduce emissions, we still have a long way to go.”

Carbon dioxide levels

CO2 levels are now more than 50% higher than they were before the onset of the industrial era.

“Every year we see carbon dioxide levels in our atmosphere increase as a direct result of human activity,” said NOAA Administrator Rick Spinrad, Ph.D. “Every year, we see the impacts of climate change in the heat waves, droughts, flooding, wildfires and storms happening all around us. While we will have to adapt to the climate impacts we cannot avoid, we must expend every effort to slash carbon pollution and safeguard this planet and the life that calls it home.”

CO2 pollution is generated by burning fossil fuels for transportation and electrical generation, by cement manufacturing, deforestation, agriculture and many other practices. Like other greenhouse gases, COtraps heat radiating from the planet’s surface that would otherwise escape into space, amplifying extreme weather events, such as heat waves, drought and wildfires, as well as precipitation and flooding.

Rising CO2 levels also pose a threat to the world’s ocean, which absorbs both CO2 gas and excess heat from the atmosphere. Impacts include increasing surface and subsurface ocean temperatures and the disruption of marine ecosystems, rising sea levels and ocean acidification, which changes the chemistry of seawater, leading to lower dissolved oxygen, and interferes with the growth of some marine organisms.

This year, NOAA’s measurements were obtained from a temporary sampling site atop the nearby Mauna Kea volcano, which was established after lava flows cut off access to the Mauna Loa observatory in November 2022. Scripps’s May measurements were taken at Mauna Loa, after NOAA staff successfully repowered a Scripps instrument with a solar and battery system in March.

Climate Change

The Mauna Loa data, together with measurements from sampling stations around the world, are incorporated by NOAA’s Global Monitoring Laboratory into the Global Greenhouse Gas Reference Network, a foundational research dataset for international climate scientists and a benchmark for policymakers attempting to address the causes and impacts of climate change.

Widely considered the premier global sampling location for monitoring atmospheric CO2, NOAA and Scripps observatory operations were abruptly suspended on Nov. 29, 2022 when lava flows from the eruption of Mauna Loa volcano buried more than a mile of access road and destroyed transmission lines delivering power to the observatory campus. After a 10-day interruption, NOAA restarted greenhouse gas observations on Dec. 8 from a temporary instrument installation on the deck of the University of Hawaii observatory, located near the summit of Mauna Kea volcano. Scripps Oceanography initiated air sampling at Mauna Kea on Dec. 14, 2022 and resumed sampling at Mauna Loa on March 9, while maintaining their Mauna Kea observations.

Mauna Loa and Mauna Kea

Continuous daily samples were obtained from both Mauna Loa and Mauna Kea by Scripps Oceanography during May, the month when CO2 levels in the Northern Hemisphere reach their maximum levels for the year. Scripps recorded a May CO2  reading from Maunakea of 423.83, which is very close to the reading of 423.78 from Mauna Loa.

The Mauna Loa observatory is situated at an elevation of 11,141 feet above sea level, while the Mauna Kea sampling location is slightly higher, at an elevation of 13,600 feet. Scientists are able to sample air undisturbed by the influence of local pollution or vegetation, and produce measurements that represent the average state of the atmosphere in the Northern Hemisphere from both locations.

Scripps Oceanography geoscientist Charles David Keeling initiated on-site measurements of CO2 at NOAA’s Mauna Loa weather station in 1958. Keeling was the first to recognize that CO2 levels in the Northern Hemisphere fell during the growing season, and rose as plants died back in the fall. He documented these CO2 fluctuations in a record that came to be known as the Keeling Curve. He was also the first to recognize that, despite the seasonal fluctuation, CO2 levels rose every year.

NOAA began measurements in 1974, and the two research institutions have made complementary, independent observations ever since.

(Editor’s Note: The San Diego County Water Authority has partnered with the Scripps Institution of Oceanography at UC San Diego to better predict atmospheric rivers and improve water management before, during, and after those seasonal storms.)